


Figure 1. Control of serotonin neural activity by light

Figure 1. Control of serotonin neural activity by light
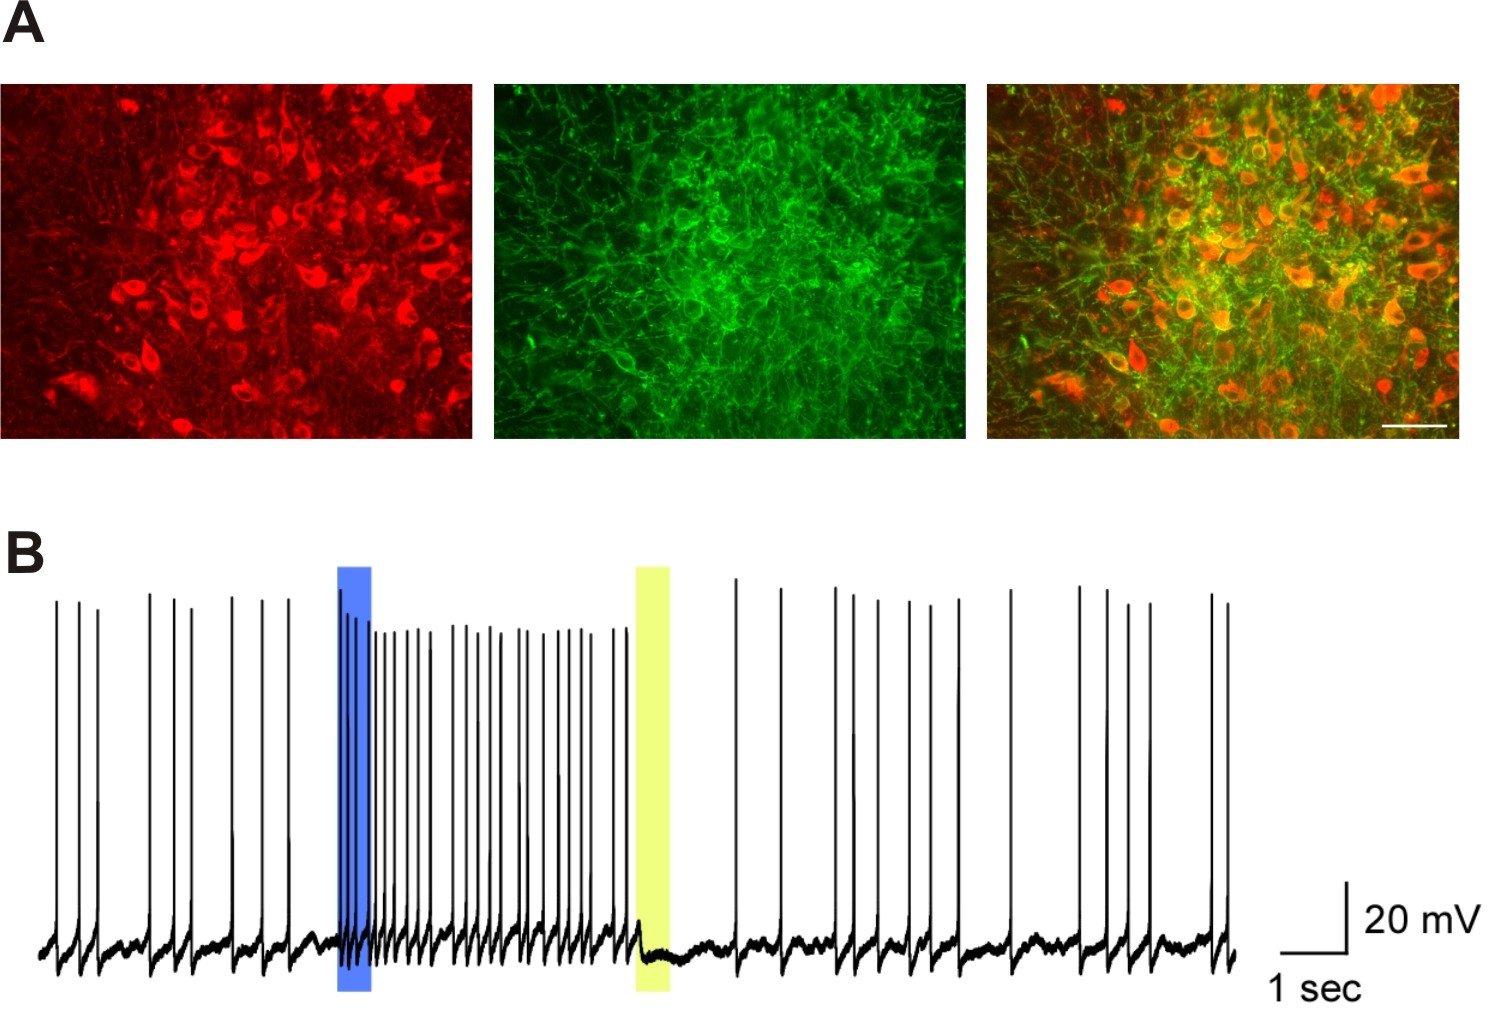
(A) The picture on the left shows serotonin neurons in red. The middle picture shows neurons expressing light sensitive proteins in green. The picture on the right is an overlay of the previous two pictures, showing in orange light sensitive proteins selectively expressed in serotonin neurons.
(B) Blue light illumination, 500 microsecond pulse, shown in blue line, induced spontaneous action potentials in the serotonin neuron for approximately 10 seconds. The yellow light illumination, 500 microsecond pulse, shown in yellow line, stopped spontaneous action potentials.
Copyright OIST (Okinawa Institute of Science and Technology Graduate University, 沖縄科学技術大学院大学). Creative Commons Attribution 4.0 International License (CC BY 4.0).
Tags


