


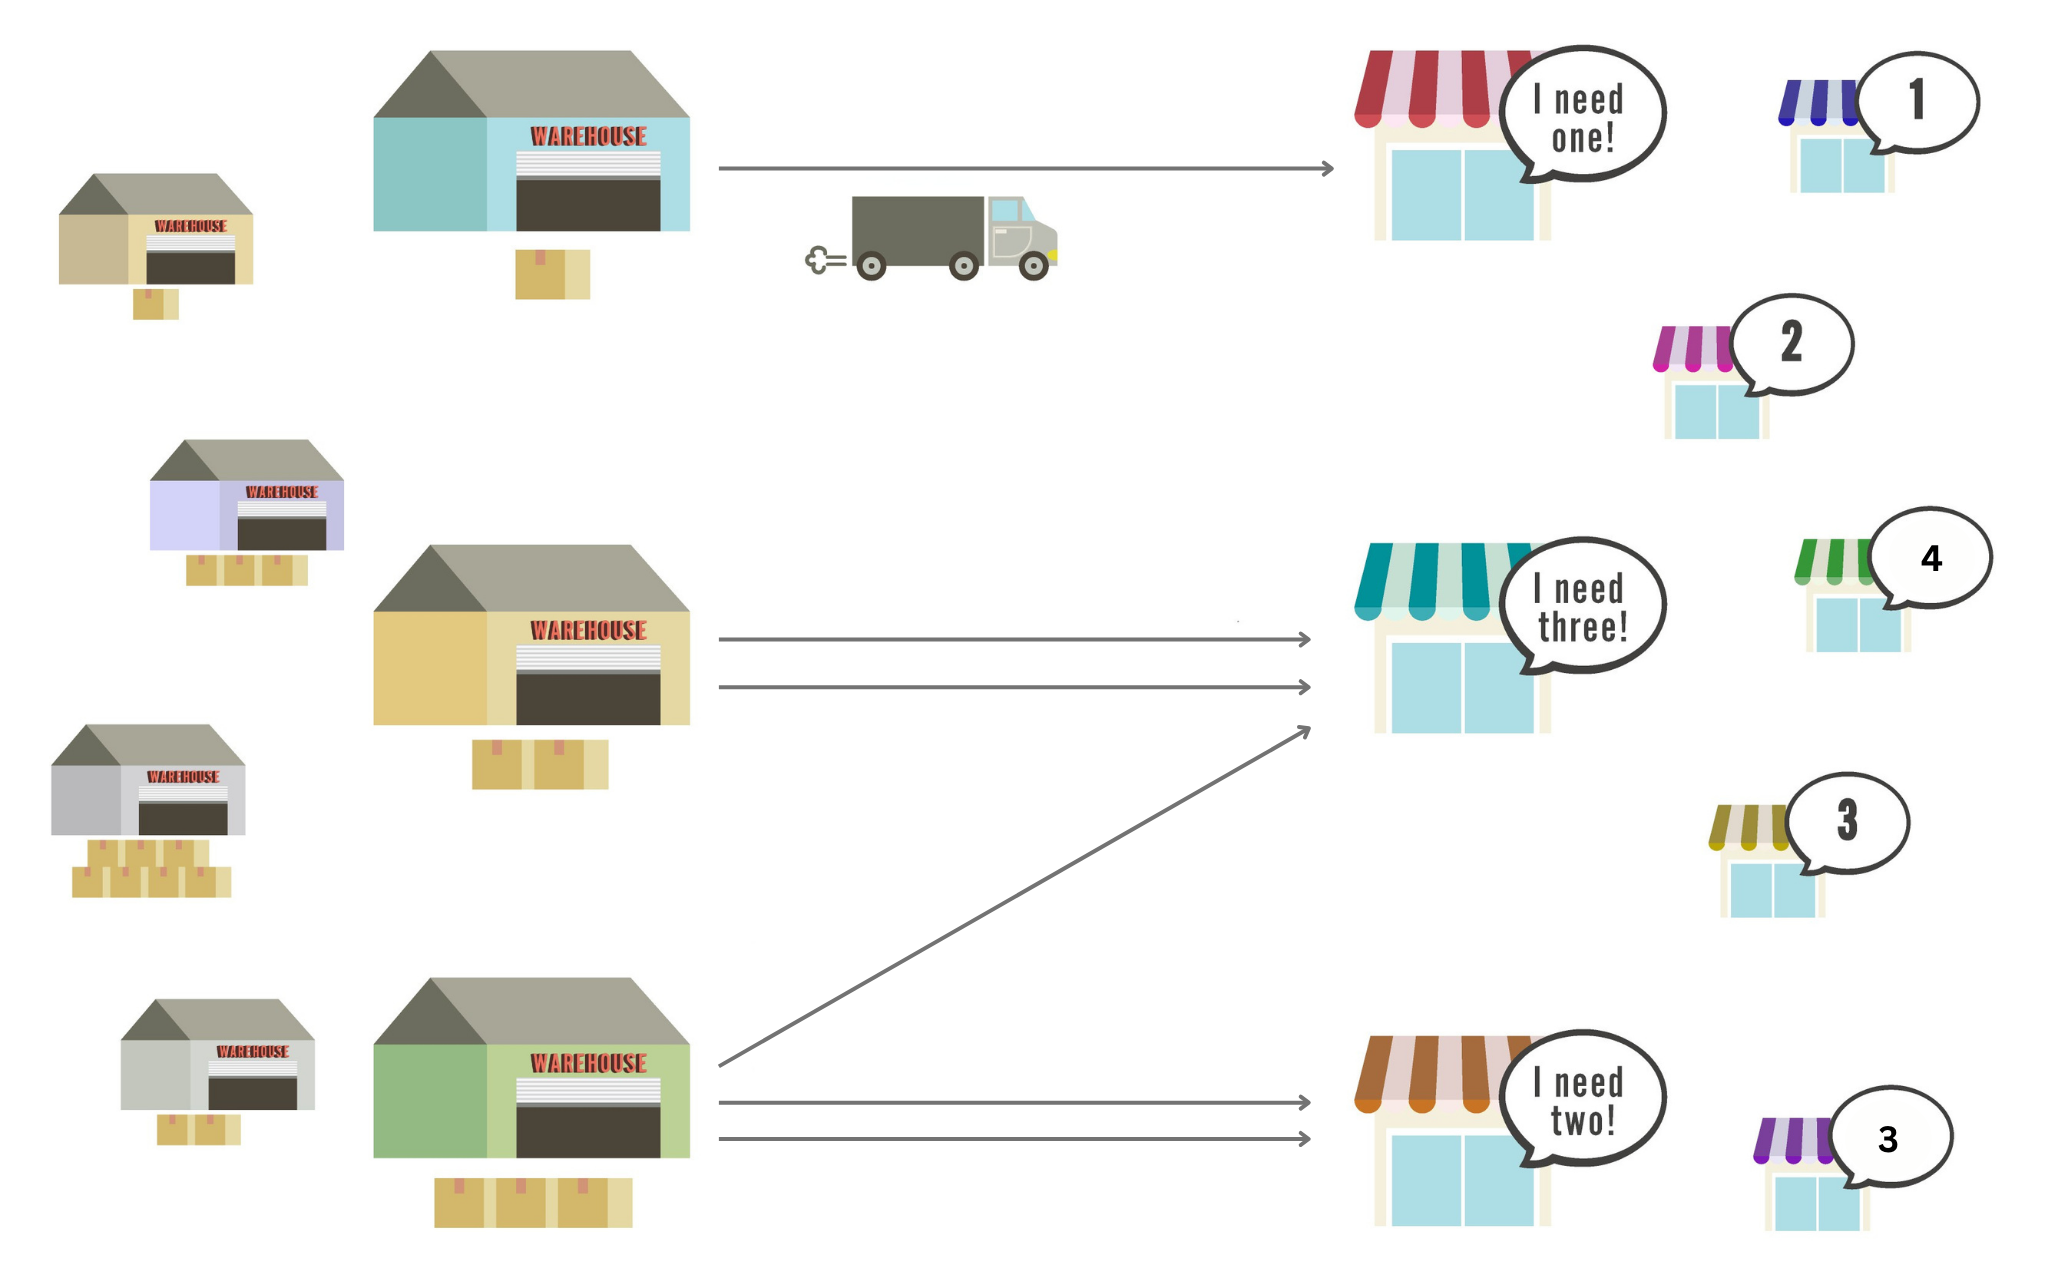
最適輸送の簡略化したイラスト

最適輸送問題を示す簡略化したイラスト。表面上は単純に見えるが、配送ポイント(倉庫と工場)間の最適なルートを計算する計算複雑さは、ポイントの数が増えるにつれ急激に増加する。
日付:
2025年5月19日
出典:
瀬良垣香織(OIST)
Copyright OIST (Okinawa Institute of Science and Technology Graduate University, 沖縄科学技術大学院大学). Creative Commons Attribution 4.0 International License (CC BY 4.0).
シェア:


