


Measuring image quality and stability

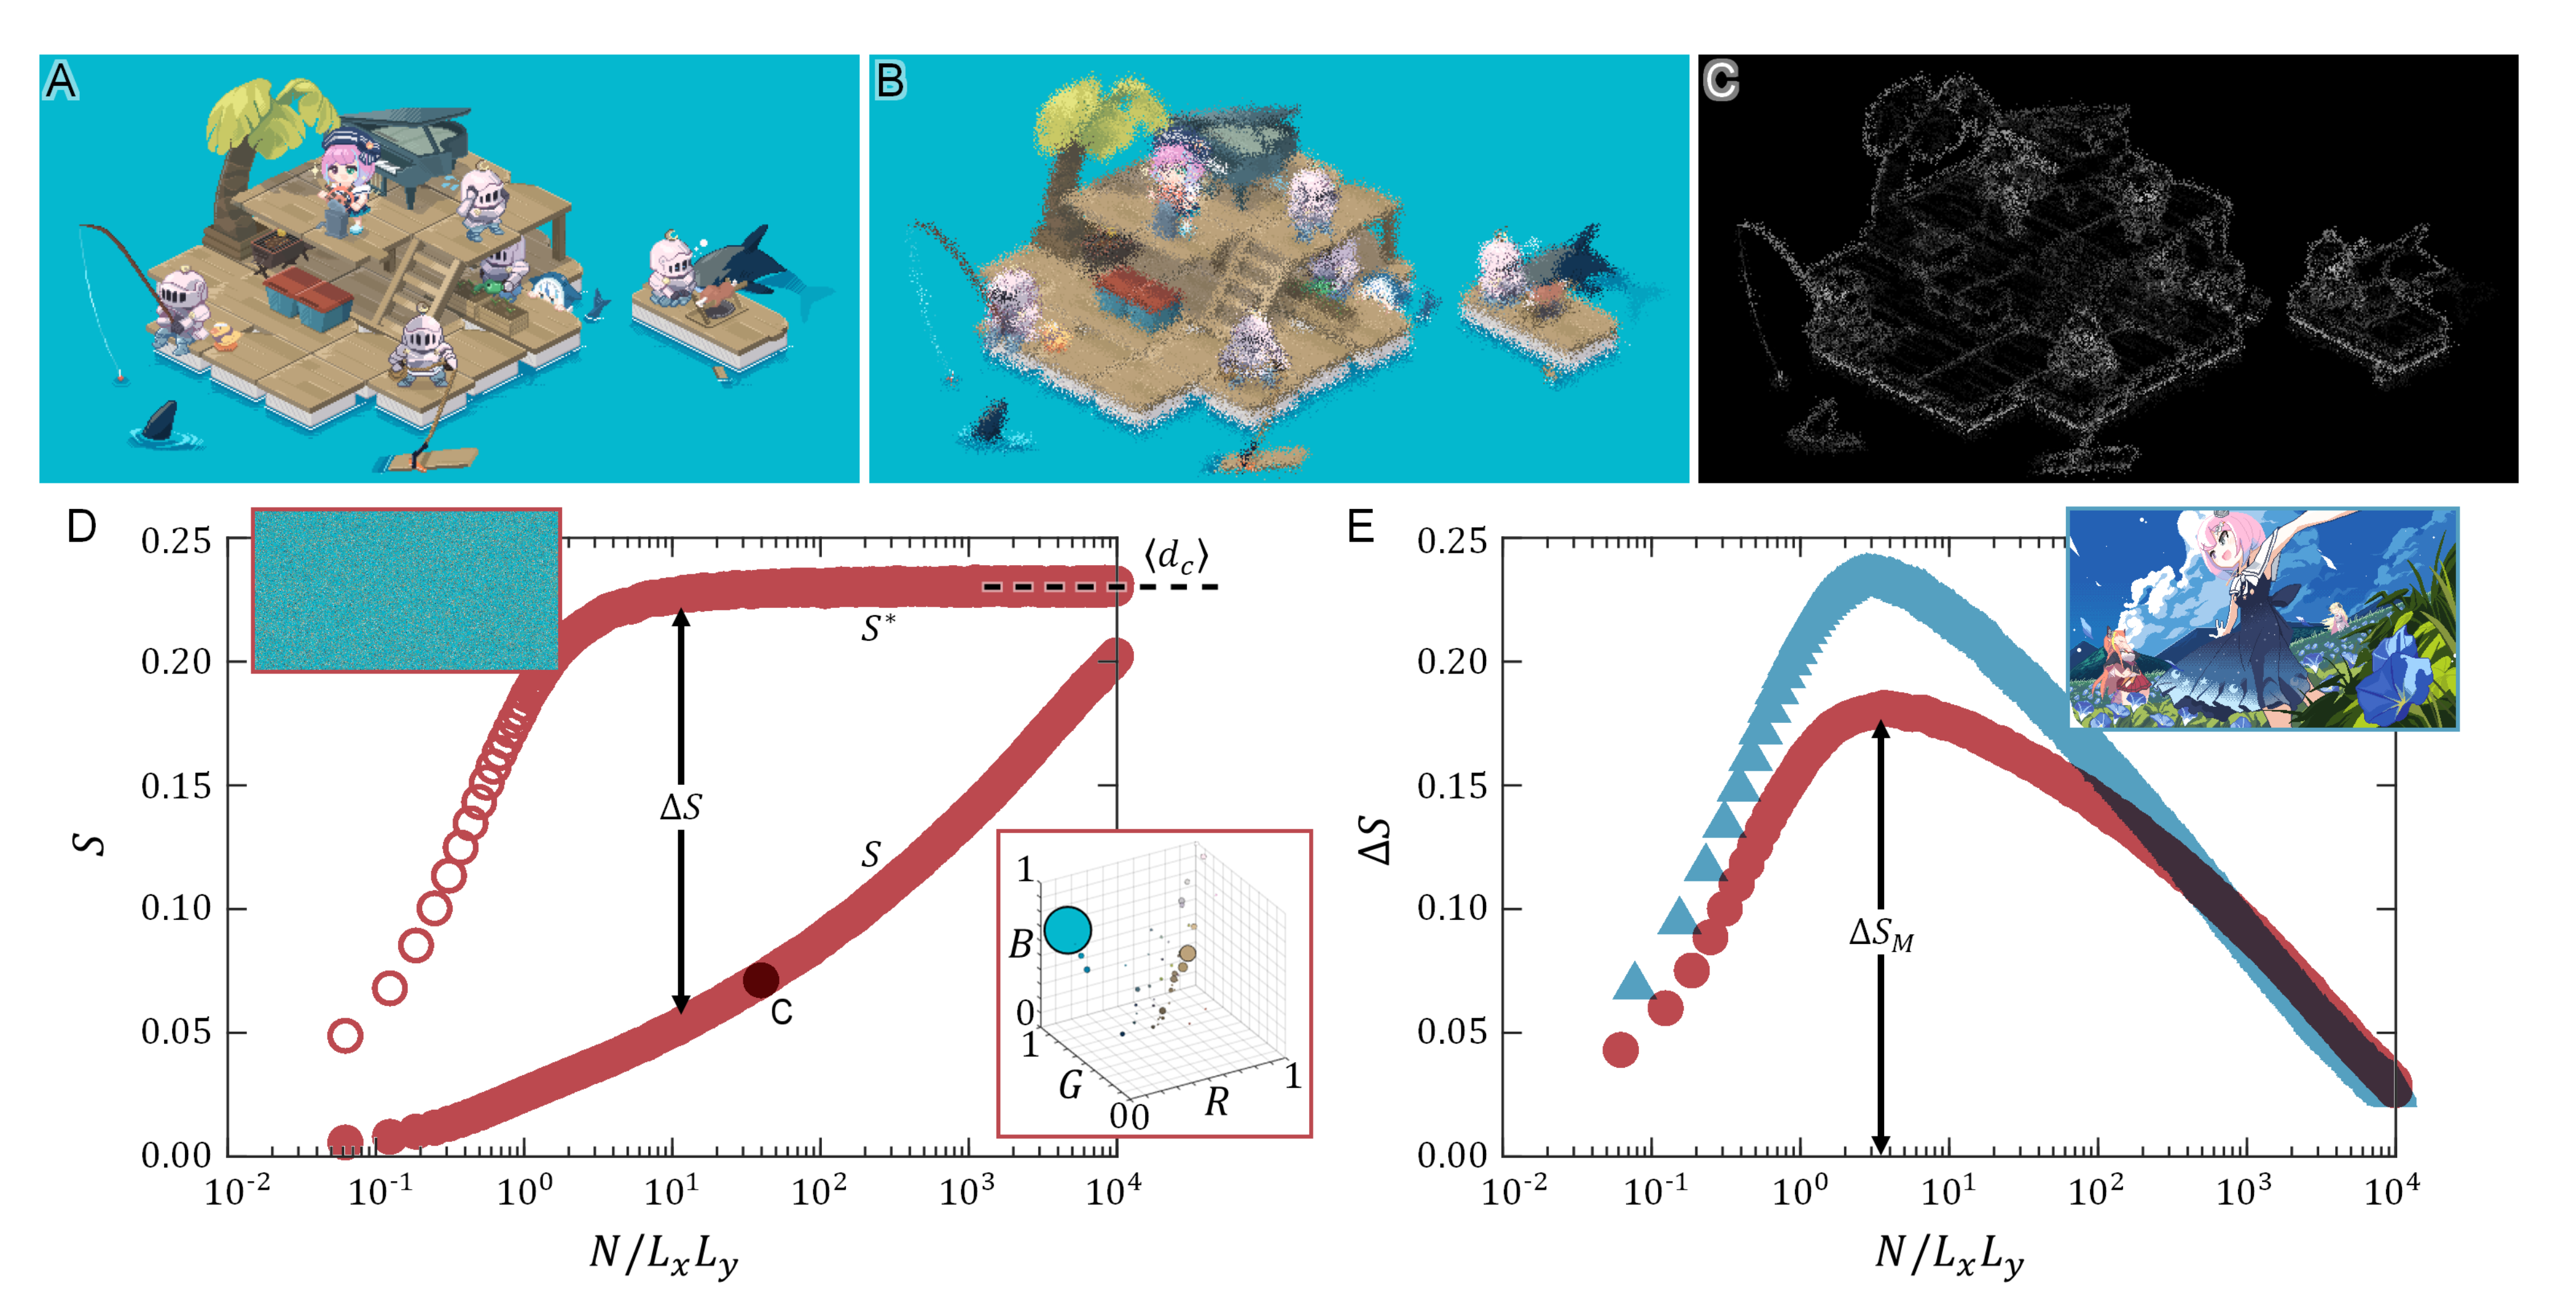
Measuring image quality and stability. (A) Original artwork: Pixel art of Himemori Luna and her knight mascots (Hololive Production) on a raft; (B) Blurred version after 650,000 pixel flips – the artwork's structure degrades, but the raft shape remains visible; (C) Color Distance Map: A grayscale image showing structural stability – black areas are stable, white areas are not; (D) Degradation score: Shows how the artwork's structure changes with pixel flips, compared to a completely shuffled version; (Inset in D) Color distribution: A 3D scatter plot of the 50 most frequent colors in the artwork, showing their distribution in red-green-blue space; (E) Structural stability: Defines a metric (∆S) to measure structural stability, which is maximized when the number of pixel flips is about equal to the image size.
Copyright OIST (Okinawa Institute of Science and Technology Graduate University, 沖縄科学技術大学院大学). Creative Commons Attribution 4.0 International License (CC BY 4.0).


