


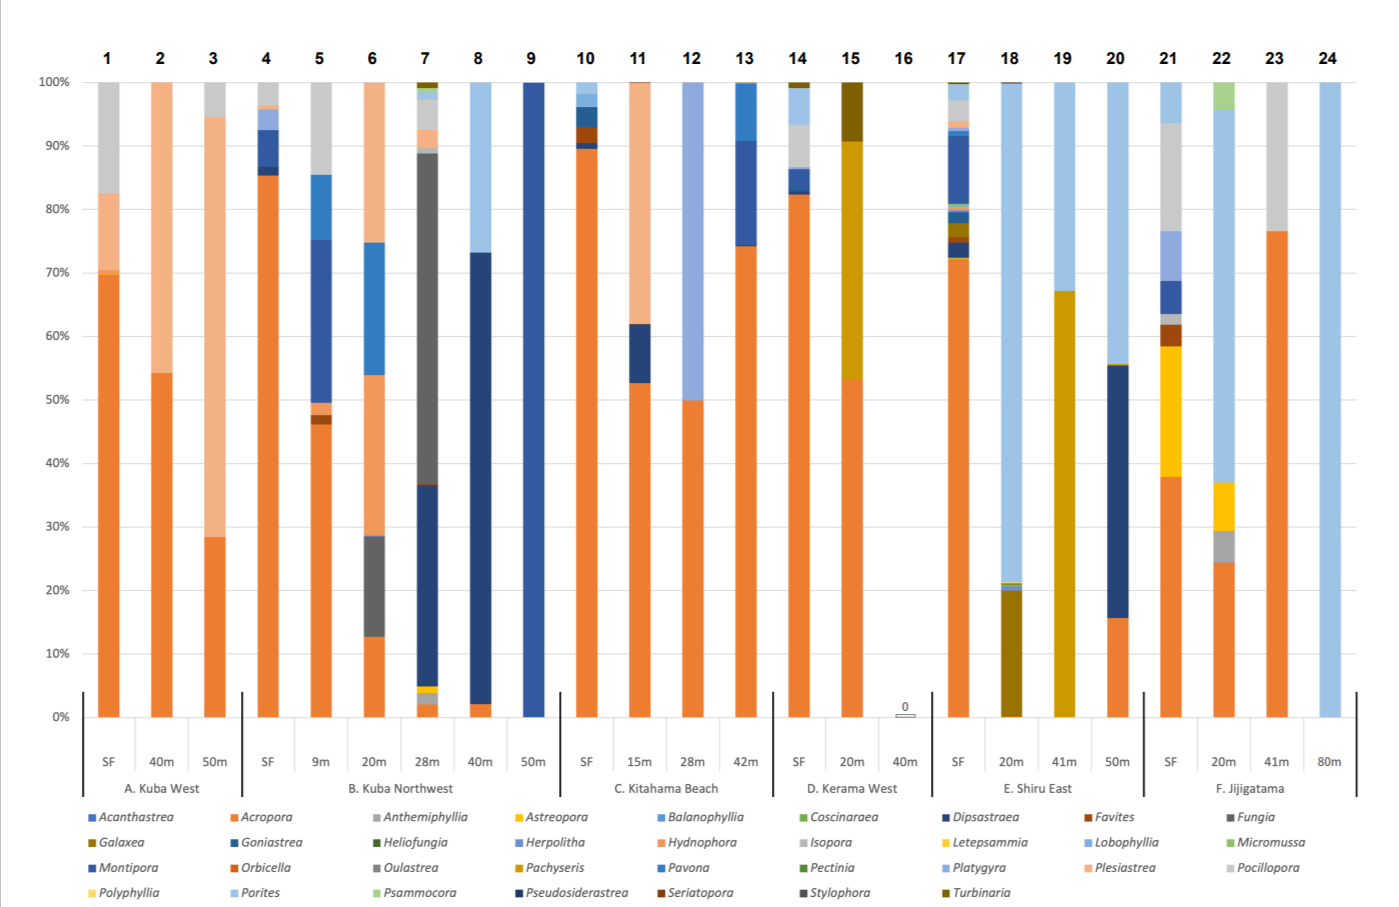
Bar graph showing the distribution and approximate proportions of Scleractinian corals at each monitoring site

Bar graph showing the distribution and approximate proportions of scleractinian corals at each monitoring site at the Kerama Islands. Names of Scleractinian coral genera are shown in different colors at the bottom. Numbers 1-24 indicate eDNA sampling sites with approximate depths in meters. SF refers to surface seawater.
Date:
15 February 2024
Copyright OIST (Okinawa Institute of Science and Technology Graduate University, 沖縄科学技術大学院大学). Creative Commons Attribution 4.0 International License (CC BY 4.0).
Share on:


