ncu Annual Reports FY2015 14

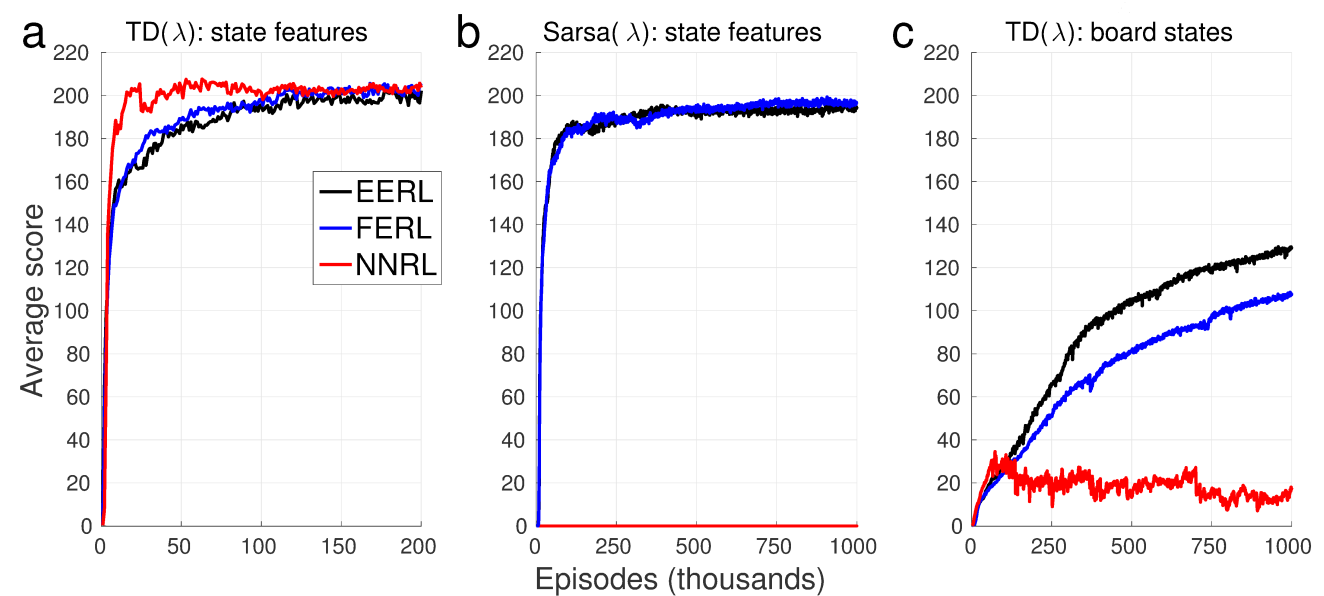
Figure 3.3.2: The average score computed over every 1000 episodes and 5 simulation runs in the three learning settings for SZ-Tetris: (a) TD(l) with state features, (b) SARSA(l) with state features, (c) TD(l) with board states.
Date:
05 March 2024
Copyright OIST (Okinawa Institute of Science and Technology Graduate University, 沖縄科学技術大学院大学). Creative Commons Attribution 4.0 International License (CC BY 4.0).
Share on: