


Differences between whole-brain connectomes when using a fiber-tracking algorithm with optimized versus default parameters
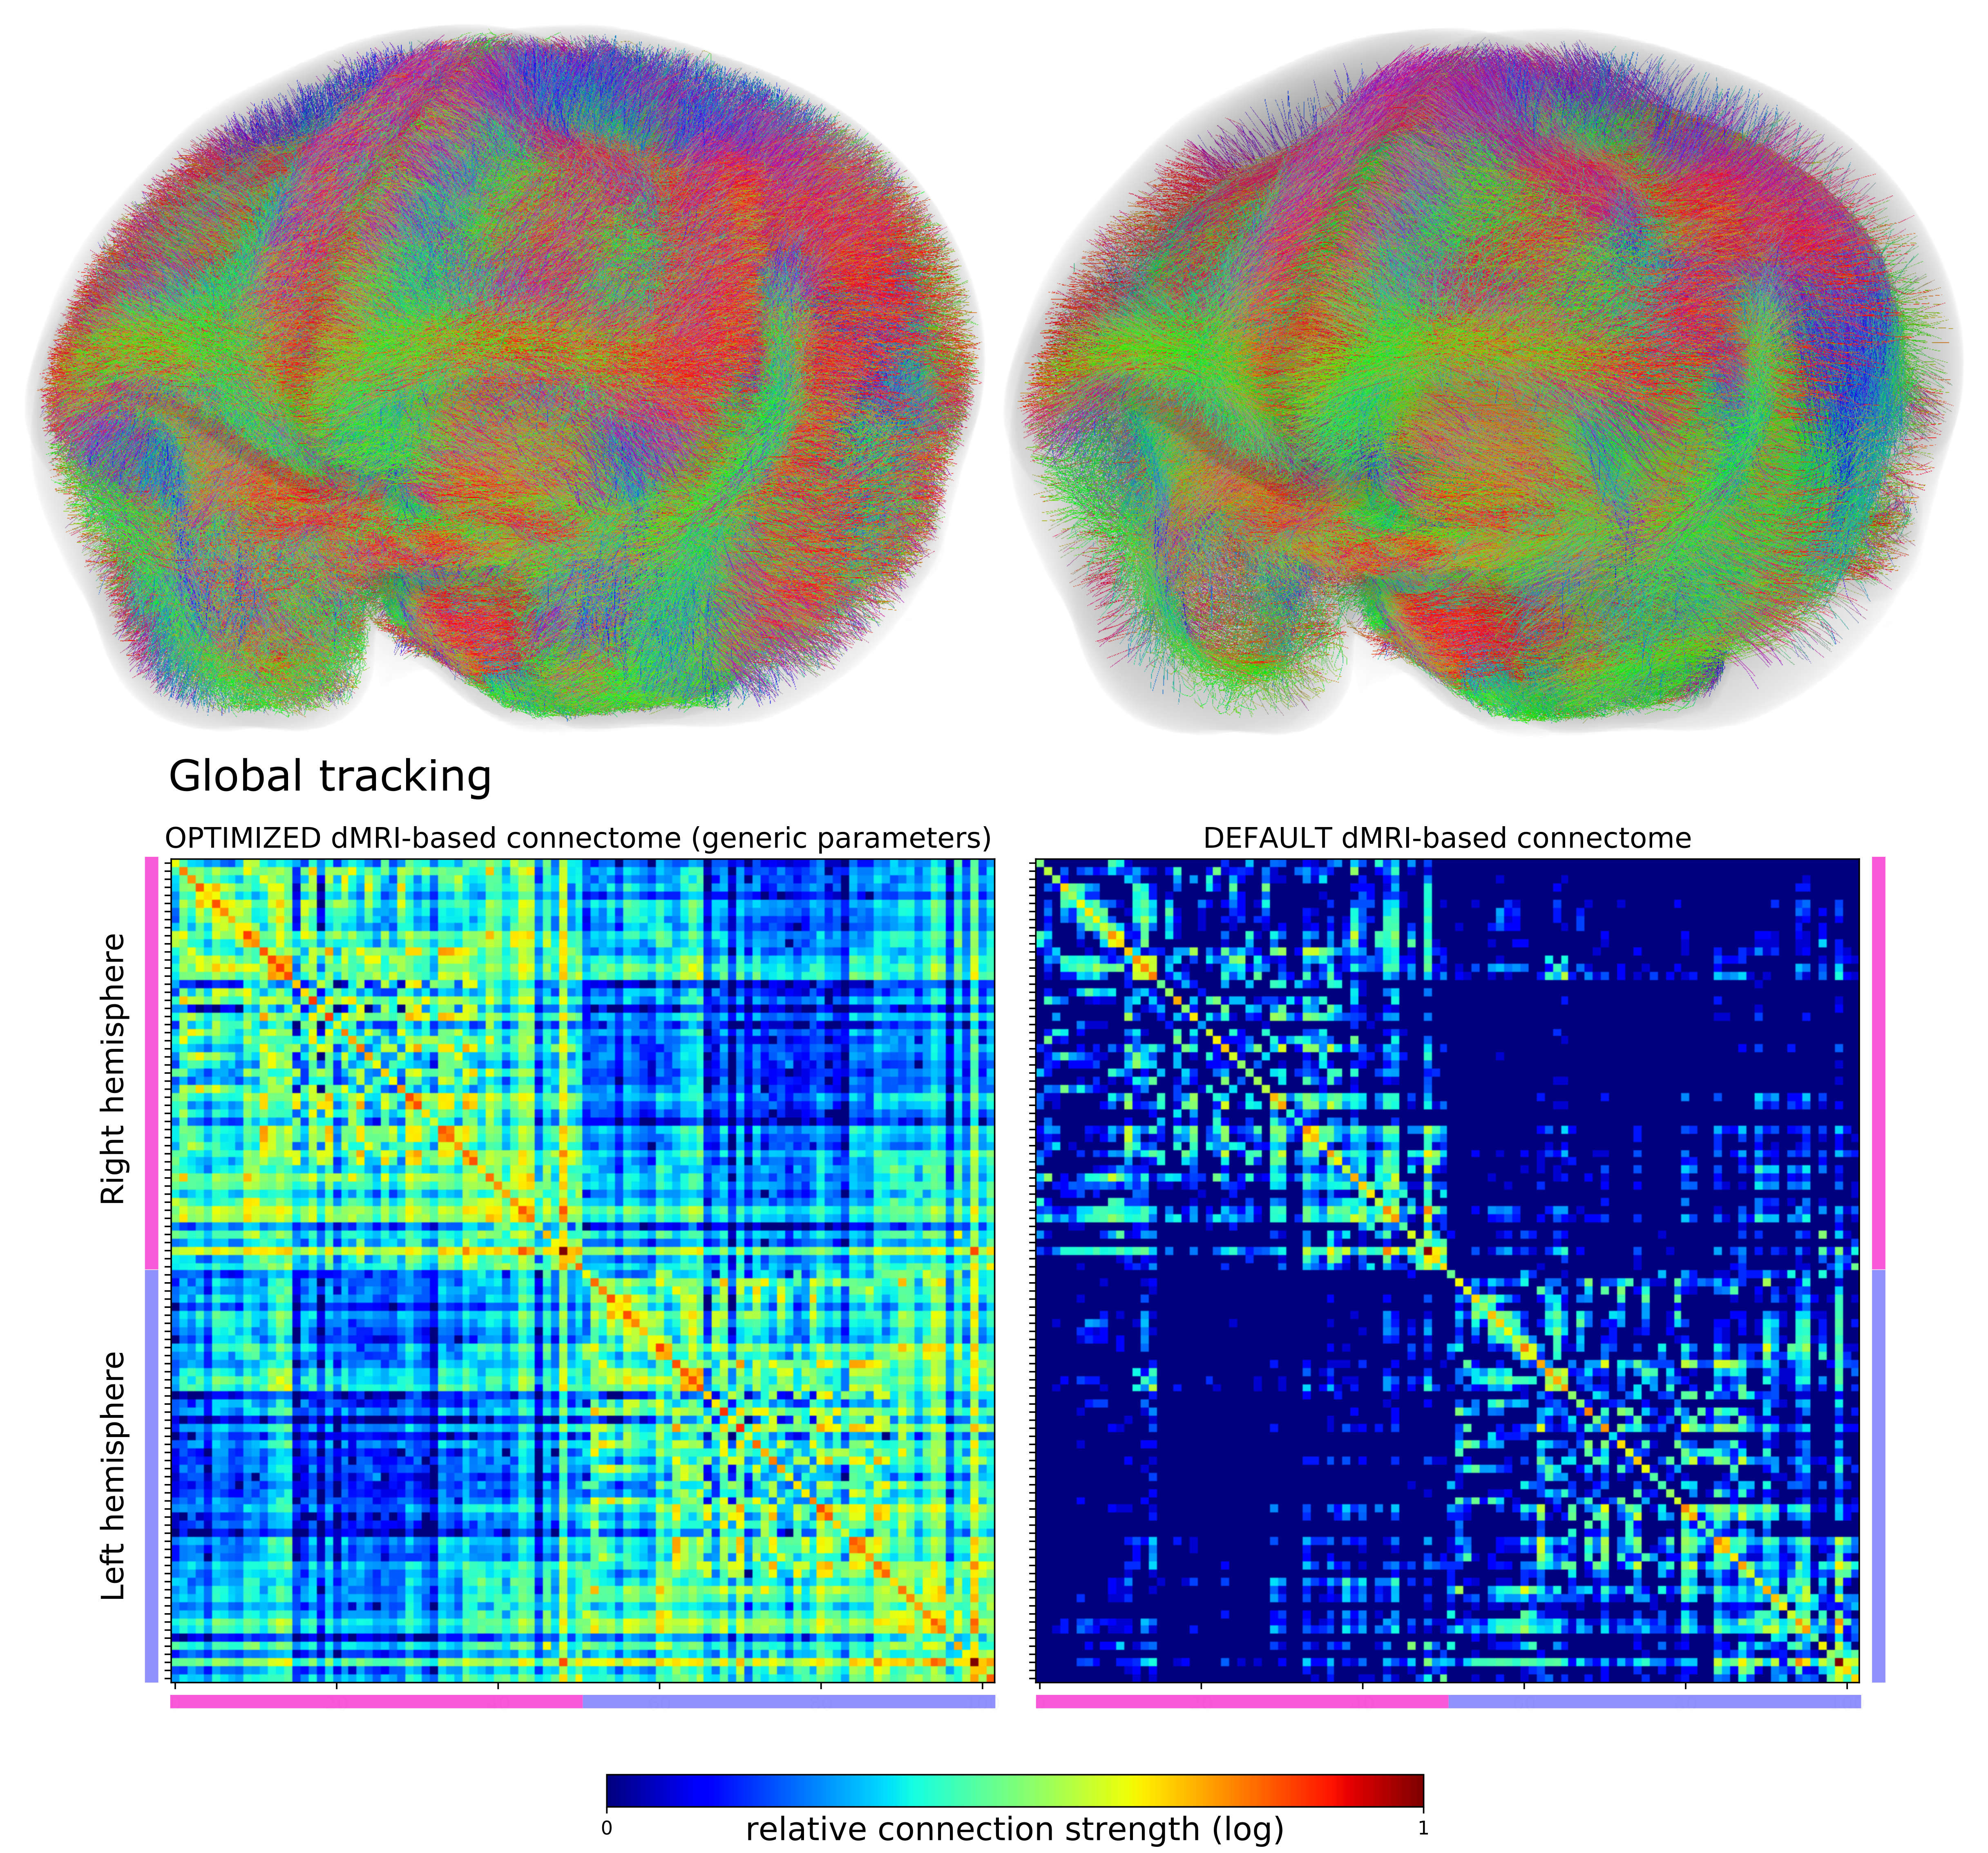
(Top left) The image shows all the estimated fibers in the whole brain of a marmoset using a diffusion MRI-based fiber tracking algorithm with generic set of optimized parameters. (Top right) The image shows the same marmoset brain but the connectome is generated using the same algorithm with default parameters. There are noticeably fewer fibers. (Bottom) The two matrices show the strength of connection (density of nerve fibers) between one brain region and another brain region. The left matrix shows that the algorithm with the genetic set of optimized parameters detected a higher density of nerve fibers connecting the brain regions compared to the right matrix, which shows that the default algorithm detected a much lower density of nerve fibers.
(Top left) The image shows all the estimated fibers in the whole brain of a marmoset using a diffusion MRI-based fiber tracking algorithm with generic set of optimized parameters. (Top right) The image shows the same marmoset brain but the connectome is generated using the same algorithm with default parameters. There are noticeably fewer fibers. (Bottom) The two matrices show the strength of connection (density of nerve fibers) between one brain region and another brain region. The left matrix shows that the algorithm with the genetic set of optimized parameters detected a higher density of nerve fibers connecting the brain regions compared to the right matrix, which shows that the default algorithm detected a much lower density of nerve fibers.
Copyright OIST (Okinawa Institute of Science and Technology Graduate University, 沖縄科学技術大学院大学). Creative Commons Attribution 4.0 International License (CC BY 4.0).
Tags


