


24 February 2023
New Insights into Chordate Body Plan Development Answer Long-Standing Questions on Evolution

Echinoderms (starfish and sea urchins) and chordates evolved from a common ancestor millions of years ago. Yet, the evolution of the complex chordate body plan remains a key unanswered tenet of evolutionary biology. A study from Okinawa Institute of Science and Technology Graduate University compared the larval body plan of starfish with that of chordates based on the expression of homologous development-relevant genes, revealing how different ancestor-derived tissues gave rise to body structures in chordates.
Life began on earth more than 3.5 billion years ago, but the history of humans and other vertebrates accounts for only a fraction of this timescale. Chordates (a group that includes vertebrates) and echinoderms (like starfish and sea urchins) are believed to have evolved from a common deuterostome ancestor around 500 million years ago. However, how the complex and sophisticated body plan of chordates evolved is still not fully clear, despite its importance from an evolutionary and developmental biology perspective. This topic has thus been the subject of much debate among experts for a long time.
Now, an answer is in sight, thanks to a recent study published in the journal Developmental Biology by Dr. Hitoshi Tominaga, Dr. Koki Nishitsuji, and Prof. Noriyuki Satoh from Japan’s Okinawa Institute of Science and Technology Graduate University.
Both embryological and larval development in animals are regulated by a set of patterning genes whose expression provides a blueprint of the body plan. “Echinoderms are a sister group of chordates. Hence, insights into their developmental patterns could provide useful information on body plan development in chordates. Therefore, we examined gene expression patterns during the developmental stages in starfish, especially because their mode of embryogenesis is more common among echinoderms than that of sea urchins,” comments Prof. Satoh, who led this study.
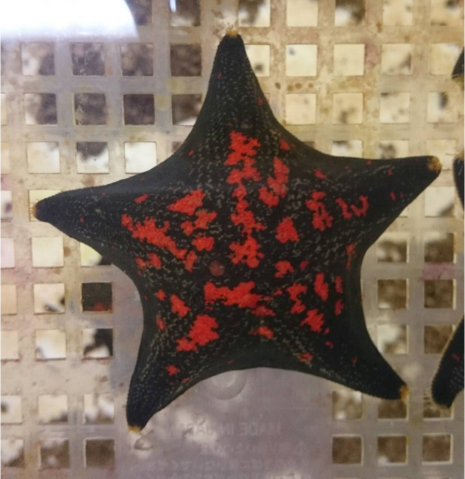
For expression analysis, the team targeted the gastrulae (embryos) and bipinnaria larvae of starfish, also known by the scientific name Patiria pectinifera. They analyzed gene expression at the single-cell level in these larvae using RNA sequencing and classified each cell into 22 clusters based on their specific, shared profiles of development-relevant gene expression (Fig. 1). “Previously, we could only examine RNA expression at the tissue level by single genes, which only gave us broad insights into development plans,” explains Dr. Tominaga. His colleague, Dr. Nishitsuji, adds, “Advancements like single-cell RNA sequencing have given us the ability to dissect these processes at the cellular level by a set of genes” (Fig. 1).
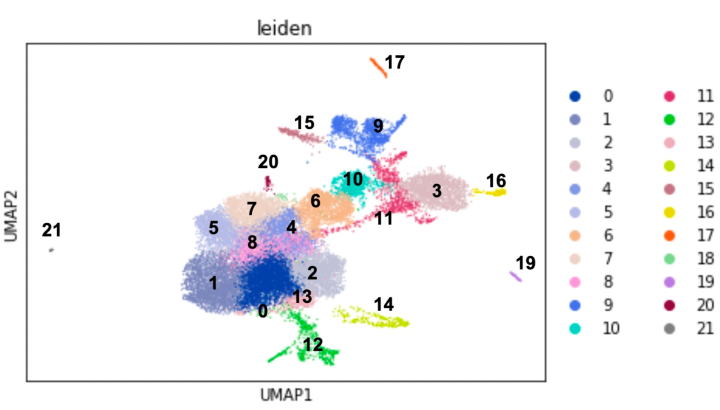
Based on shared expression profiles of transcription factor genes and cellular signaling molecule genes, constituent cells of starfish embryos and larvae can be categorized into 22 clusters, numbered 0 to 21. Each dot represents each cell.
Based on shared expression profiles of transcription factor genes and cellular signaling molecule genes, constituent cells of starfish embryos and larvae can be categorized into 22 clusters, numbered 0 to 21. Each dot represents each cell.
Through their RNA sequencing analysis, they developed a map of development-relevant transcription factor and signaling molecule genes expressed in multiple developmental structures—including the oral and aboral ectoderm, apical plate, hindgut and midgut, endomesoderm, stomodeum, and mesenchyme in gastrulae, as well as neurons, ciliary bands, enterocoel, and muscles in larvae (Fig. 2).
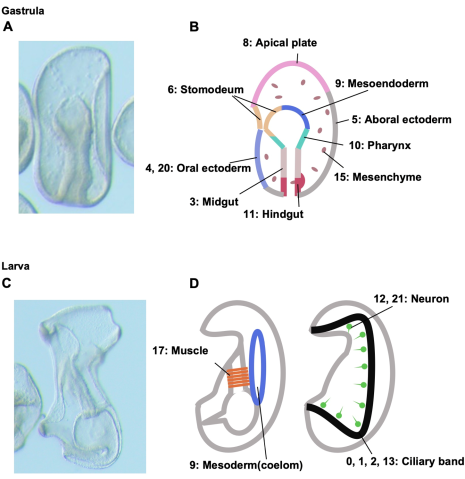
(A) Gastrula (left side view). (B) Anatomical distribution of each cluster in gastrulae. (C) An early larva, left side view. (D) Anatomical distribution of each cluster in early larvae. Cluster numbers are shown with corresponding germ layers, organs, and tissues. This figure shows that for examples cells of cluster 8 comprise apical plate and cells of cluster 9 comprise coelom, a mesodermal derivative.
(A) Gastrula (left side view). (B) Anatomical distribution of each cluster in gastrulae. (C) An early larva, left side view. (D) Anatomical distribution of each cluster in early larvae. Cluster numbers are shown with corresponding germ layers, organs, and tissues. This figure shows that for examples cells of cluster 8 comprise apical plate and cells of cluster 9 comprise coelom, a mesodermal derivative.
The next step was to compare this map with a map of the chordate larval body plan based on expression of homologous (similar between two different species) development-relevant genes. Amphioxus, an ancient chordate believed to represent the origin of vertebrates like humans, was chosen as the chordate model. Special attention was paid to the ciliary bands (Fig. 3), coelom, stomodeum, and pharynx of echinoderm larvae. Through comparative analysis of starfish and amphioxus larvae, the researchers proposed a new idea for how the chordate body plan evolved from a deuterostome ancestor. Prof. Satoh elaborates, “Through this analysis and comparison of homologous genes, we could understand which tissues or cells from the ancestor may have evolved into chordate structures and ambulacrarian structures as well.”
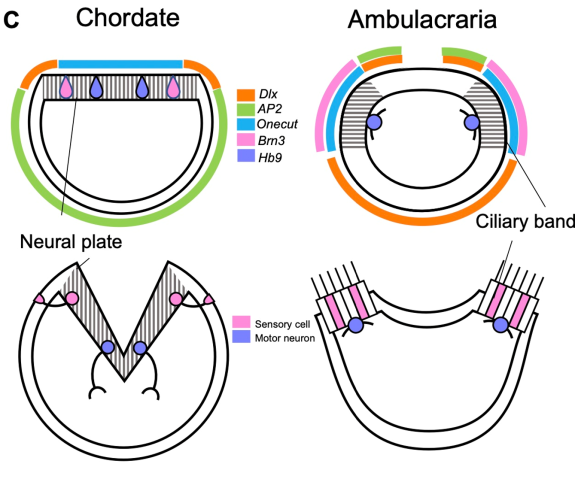
Both chordate neural plate and ambulacrarian ciliary bands develop using a similar set of genes, suggesting these two organs are homologous.
Both chordate neural plate and ambulacrarian ciliary bands develop using a similar set of genes, suggesting these two organs are homologous.
Specifically, the team found that the chordate nervous system, such as those in humans, evolved from an embryonic region of the ancestor that corresponds to echinoderm ciliary bands (Fig. 3). Moreover, the chordate lateral mesoderm—which gives rise to structures like the circulatory system and body wall muscles—likely evolved from the echinoderm coelom of the embryo in the deuterostome ancestor. Finally, the Spemann’s organizer, responsible for inducing the development of neural cells, arose from the echinoderm stomodeum of the ancestor’s embryo (Fig. 4).
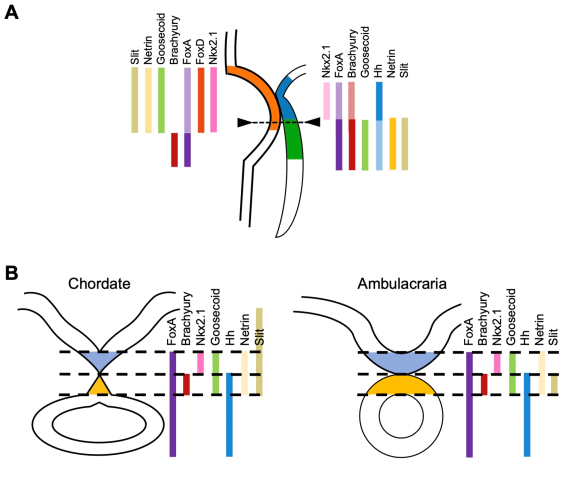
(A) Expression profiles of development-relevant genes in the stomodeal (mouth opening) region. The stomodeum is formed by stomodeal ectoderm (orange), stomodeal endoderm (blue) and oral endoderm (green). Most of genes expressed in these regions are major component genes of vertebrate Spemann’s organizer. (B) (Left) Gene expression pattern of chordate dorsal structures (notochord + floor plate), and (right) that of starfish larval stomodeum, transverse section of dotted line of (A). This suggests the ambulacrarian stomodeum plays a role of vertebrate Spemann’s organizer.
(A) Expression profiles of development-relevant genes in the stomodeal (mouth opening) region. The stomodeum is formed by stomodeal ectoderm (orange), stomodeal endoderm (blue) and oral endoderm (green). Most of genes expressed in these regions are major component genes of vertebrate Spemann’s organizer. (B) (Left) Gene expression pattern of chordate dorsal structures (notochord + floor plate), and (right) that of starfish larval stomodeum, transverse section of dotted line of (A). This suggests the ambulacrarian stomodeum plays a role of vertebrate Spemann’s organizer.
Together, the findings provide a potential model of echinoderm and chordate development from a common deuterostome ancestor. This model answers a central question in evolutionary developmental biology, explaining how animals from different taxa developed their characteristic body plans and how these plans diverged in different groups with shared ancestry. This study represents a milestone in research on evolutionary developmental biology and sheds light on a key aspect of our own evolutionary history.
Article Information
Research Unit
Submit a press inquiry


