


Rescaling energy spectra reveals data collapse consistent with Kolmogorov’s framework

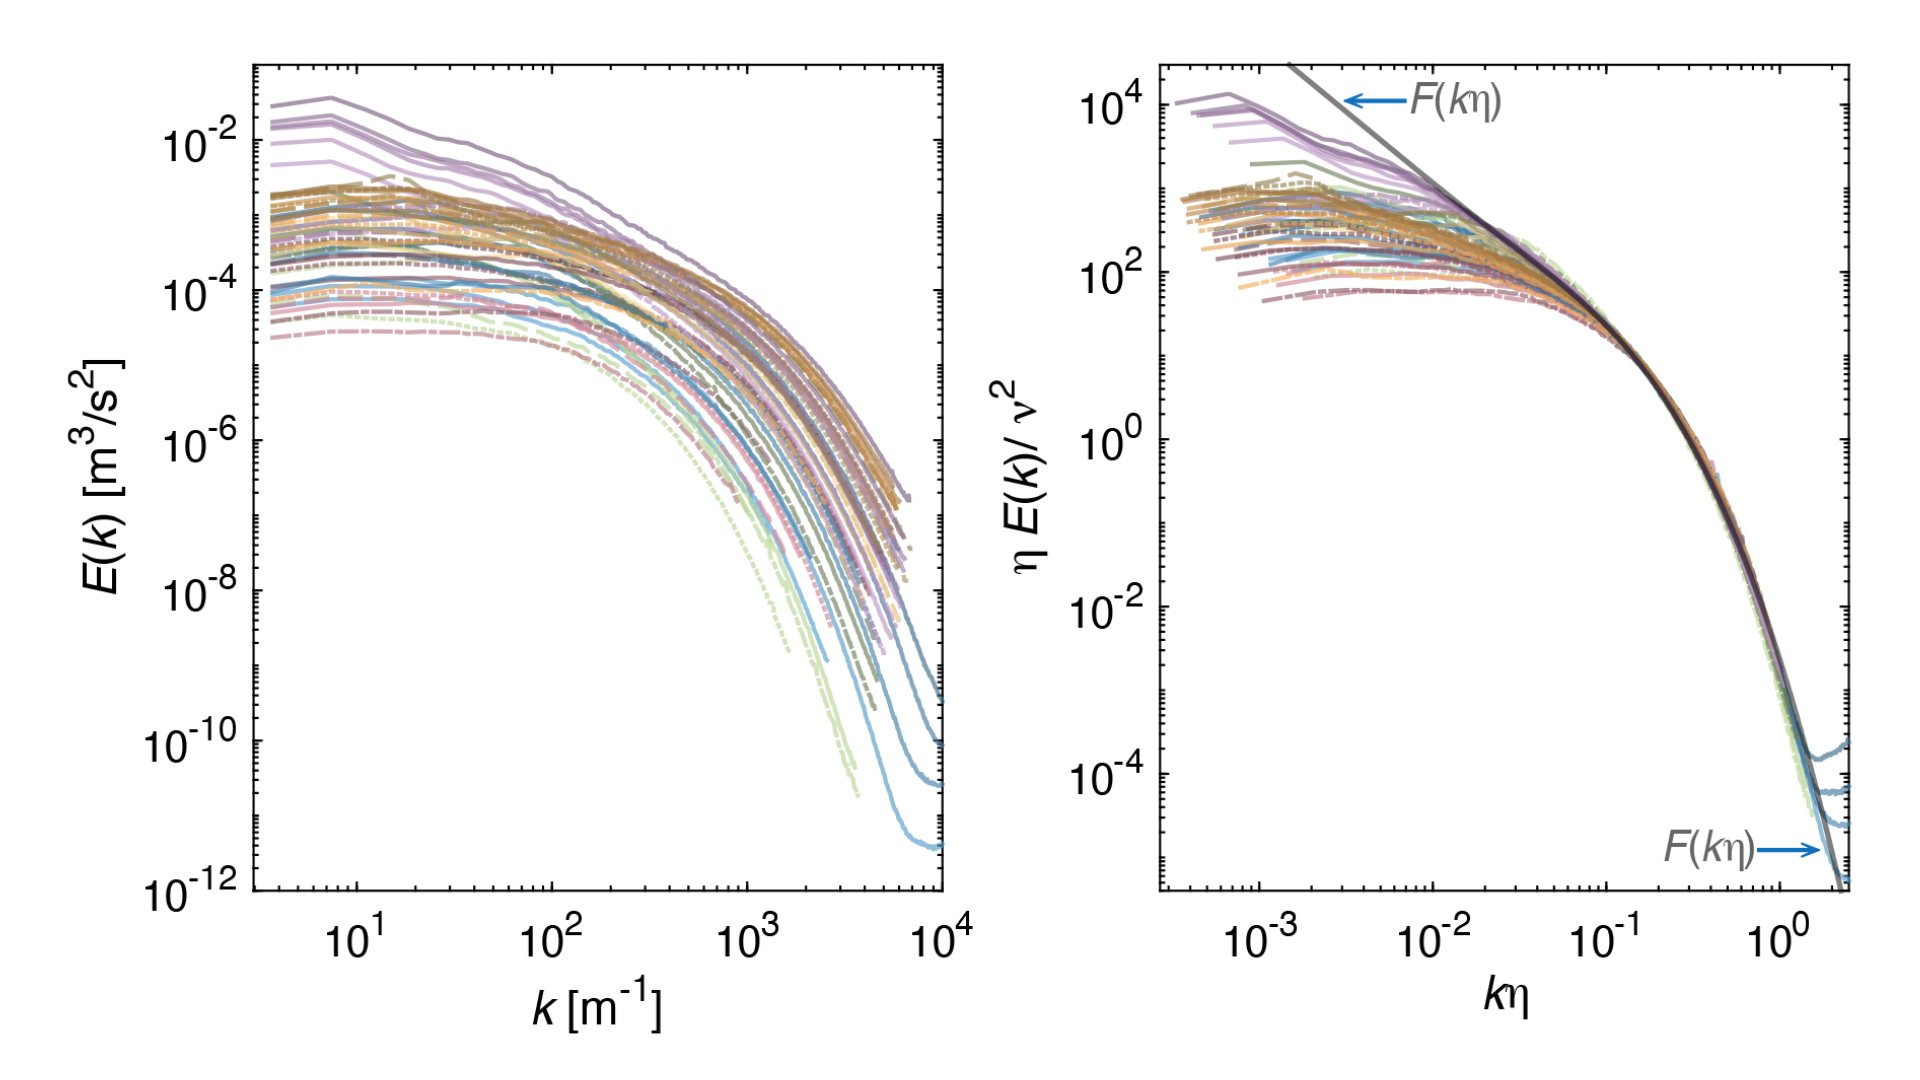
Left graph follows the conventional approach of plotting the energy spectrum, E(k), where energy is a is distributed across different eddy sizes represented by the wavenumber k. The wavenumber is inversely proportional to eddy size – large k corresponds to small eddies.
The inertial range refers to the scale of eddies that are smaller than the largest vortices – those spanning the full width of the container – but still larger than the smallest eddies where energy is lost as heat. Kolmogorov predicted that within the inertial range, the energy spectrum is proportional to eddy size, with energy decreasing at a constant of rate of -5/3: \(E(k)∝k^{-5/3}\). The celebrated “-5/3rd power law” has been found universal across virtually all turbulent flows – with the frustrating exception of TC flows. As is seen on the graph, most of the energy spectra do not follow Kolmogorov’s power law.
Right graph shows the same spectra rescaled by Kolmogorov’s general law, from which the -5/3rd law is derived, and which goes beyond the inertial range to include scales where energy dissipates into heat. Here, Kolmogorov predicted that energy spectra, rescaled using viscosity v and the smallest scale of motion η, become the universal function F(kη) at the small scales. The collapse of the rescaled data onto the universal curve F(kη), shown in gray, peeling off only at the extreme ends, demonstrates the small-scale universality of Kolmogorov’s framework across turbulent flows.
Copyright OIST (Okinawa Institute of Science and Technology Graduate University, 沖縄科学技術大学院大学). Creative Commons Attribution 4.0 International License (CC BY 4.0).


