


Mexican-hat dispersion indicative of hybridization

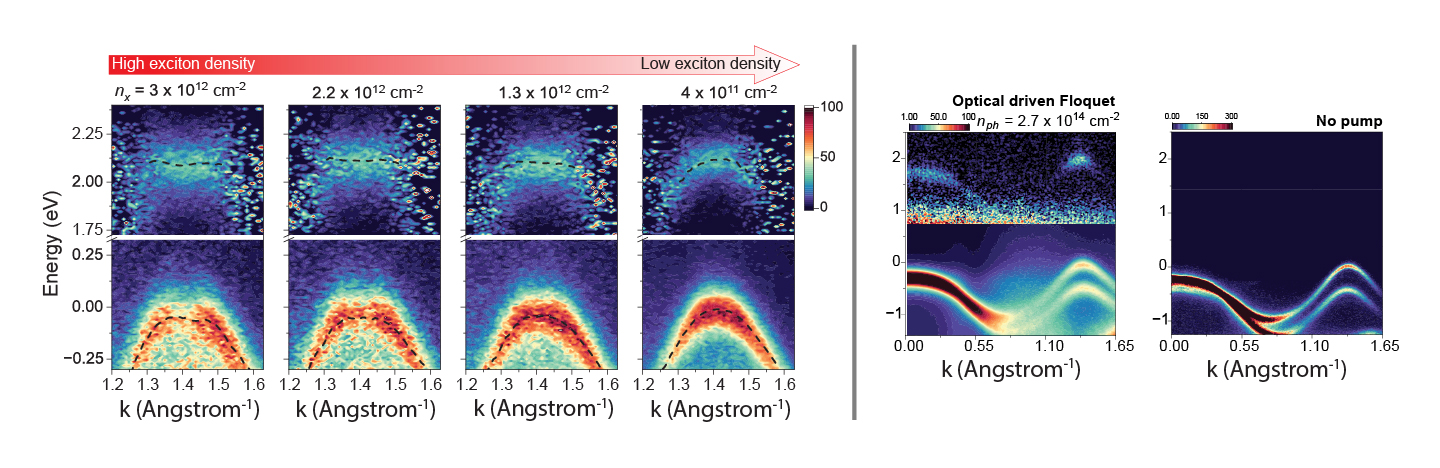
Normally, the energy levels of electrons in atomically thin semiconductors form a smooth curve (or band) when plotted across crystal momentum (k) levels, with a distinct peak in the middle, as seen on the rightmost graph.
A key indicator of Floquet hybridization is a flattening of this peak into a Mexican-hat-like shape, also called a camelback – see the leftmost graph. This flattening indicates the presence of a second, overlapping band which is invisible as electrons cannot inhabit the same point in momentum space. However, these ‘ghost’ bands influence the visible valence and conduction bands, forcing them downward in the middle. This is clearly seen in the high exciton density condition, with the strength of the effect lowering with the density of excitons. The Mexican-hat-like dispersal is also present, but only faintly visible, in the optically driven condition.
Copyright OIST (Okinawa Institute of Science and Technology Graduate University, 沖縄科学技術大学院大学). Creative Commons Attribution 4.0 International License (CC BY 4.0).


