


Principal Investigator: Takayuki Naito
Research Theme: Single-cell Biochemistry and Molecular Analysis of Brain Functions
Abstract
“Single-cell biochemistry and molecular analysis of brain functions” is the theme of our research. Our research aims to provide link between genetic and molecular events occurring in cells and brain functions. Our major research projects are (1) classification of neuronal cell types based on gene expression (the Neumap project), (2) study of activity-dependent gene expression, (Activity-dependent gene expression means modulation of gene expression occurring in individual cells as a result of various stimuli. It is thought to be correlated with self-reorganizing activities of the nervous system such as neuronal plasticity.), and (3) salamander project (We are establishing molecular neuroscience of salamander. Because salamander has large cells, it is thought to be a good material for imaging studies, electrophysiology, and single-cell analysis of the nervous system).
In FY2010, the following works were carried out to advance our research.
(1) Gene expression analysis is the basic technology to carry out our research. We have established a gene expression analysis system from tissue to single-cell level using DNA microarray and real time qPCR as well as sample collection methods.
Previously, we analyzed the gene expression of small regions of mouse brain (hippocampus, cerebellum, and retina) and single cell-type (mouse cerebellar Purkinje cell; Gene expression profiling using DNA microarray). We quantified expression levels of genes coding for “the neural communication system” components of Purkinje cell by real-time qPCR. Now we are investigating single-cell level gene expression analysis using salamander cells.
(2) To understand activity-dependent gene expression of the nervous system, our first step was the identification of activity-dependently induced genes. Whole gene analysis was carried out to identify activity-dependently induced genes in a time dependent manner by DNA microarray using primary culture of mouse hippocampal cells and cerebellar granule cells. We also studied the effect of cholecystokinin (the most abundant neuropeptide in hippocampus) on the gene expression in hippocampal networks.
(3) We previously sequenced about 12,000 representative cDNA clones selected from cDNA libraries of the brain, retina, and spinal cord of the salamander (Ambystoma mexicanum). In FY2010, we have assembled and manually edited full-length sequences of about 6,000 clones. "The neural communication system" component genes were identified and their amino acid sequences were compared to those of human and other organisms. In addition, we have improved the method for single-cell analysis of salamander cells.
(4) The application of new technologies is important for the progress of the research. We tried to apply the advanced mass spectrometry technologies to the analysis of intercellular fluid of the brain and to the lipid distribution study at cellular size resolution using salamander tissue.
These results are described in the following sections.
1. Staff
- Dr. Nozomu Nakamura, Researcher
- Michael Chandro Roy, Researcher
- Makoto Araki, Researcher
- Kouichiro Iijima, Researcher
- Seiko Kuraba, Technician
- Saori Ishida, Technician
- David Alan Richter, Technician
- Shotaro Kasai, Technician
- Kaori Yamashiro, Research Administrator
2. Collaborations
- Theme: Salamander project
- Type of collaboration: Joint research
- Researchers:
- Dr. Sydney Brenner, Okinawa Institute of Science and Technology, PC
- Theme: Lipids in the nervous system
- Type of collaboration: Joint research
- Researchers:
- Dr. Ryo Taguchi, University of Tokyo, Department of Metabolome, Graduate School of Medicine
- Theme: Mass Imaging
- Type of collaboration: Joint research
- Researchers:
- Dr. Mitsutoshi Setou, Hamamatsu University School of Medicine
- Theme: Peptidome in the brain
- Type of collaboration: Joint research
- Researchers:
- Dr. Kazuhiko Tatemoto, University of Kuopio, Finland
- Dr. Karl-Heinz Herzig, University of Kuopio, Finland
- Theme: Marine microorganism project
- Type of collaboration: Joint research
- Researchers:
- Dr. Daisuke Uemura, Keio University, Department of Biosciences and Informatics
- Theme: Study of cerebellum
- Type of collaboration: Joint research
- Researchers:
- Dr. Shigetada Nakanishi, Osaka Bioscience Institute
- Theme: Study of photopigments
- Type of collaboration: Joint research
- Researchers:
- Dr. Yoshinori Shichida, Kyoto University, Department of Biophysics
- Theme: Study of retina
- Type of collaboration: Joint research
- Researchers:
- Dr. Masao Tachibana, The University of Tokyo, Department of Psychology
- Theme: Analysis of Bioactive Molecules by Mass Spectrometry
- Type of collaboration: Joint research
- Researchers:
- Dr. Tsutomu Masujima, Hiroshima University, Department of Analytical Molecular Medicine and Devices
3. Activities and Findings
3.1 Gene expression analysis
3.1.1 Gene expression profiling of Purkinje cellsThere is a diversity of neuronal cell types in the CNS, which has been identified by morphological and electrophysiological properties, as well as neurochemical markers. It is important to elucidate gene expression in each of neuronal cell types, because gene expression underlies morphological and physiological features of neurons. Genome-wide gene expression profiles of neuronal cell types give valuable information to understand the functions of cell types in the brain circuits. However, little genome-wide study has been performed using each neuron type, so-called “single-type neuron”. Regarding neuronal function, quantitative gene expression study of the ligand-receptor and “neural communication system” components is useful to figure out modalities of signal transmission between neurons. It is also of great interest to quantitatively analyze genes coding for “the neural communication system” in “single-type neuron”.
Purkinje cells of the cerebellum are some of well-studied cell types anatomically and physiologically. Since Purkinje cells are distributed in the monolayer (Purkinje cell layer), and can be easily identified and dissected from cerebellar slices, they are eminently suited to “single-type neuron” gene expression analysis.
Previously, we constructed a gene expression profile of Purkinje cells as a model of “single-type neuron” using laser capture microdissection and DNA microarray analysis. To identify the characteristic expression pattern of Purkinje cells, this profile was compared with that of cells in the cerebellar granule (CG) cell layer, which is adjacent to the Purkinje cell layer and contains CG cells as a major component (90-98%). In this year (FY2010), by using real-time qPCR method, we quantified expression levels of genes coding for “the neural communication system” components, which include voltage-gated ion channels, ligand-gated ion channels, G protein-coupled receptors (GPCRs), neurotransmitter synthases, and neuropeptides. We have established for the first time "single-type neuron" gene-expression profiling, together with the assessment of contamination of adjacent glial and neuronal cells.
We demonstrated quantitative gene expression levels of all glutamate and GABA receptors in Purkinje cells (Fig. 1 A and C). In situ hybridization and immunohistochemistry already showed expression patterns of glutamate receptors, as well as those of GABA receptors. The merits of our quantitative gene-expression data are to elucidate the copy number of mRNAs and compare gene expression of many different genes quantitatively. Moreover, these may provide supportive information to understand patterns of receptor subunit assemblies on Purkinje cells. Our quantitative expression data showed that Purkinje cells highly express GABA receptor subunits Gabra1 (25.5% of all ionotropic glutamate and GABA receptors) and Gabbr2 (44.4% of all metabotropic glutamate and GABA receptors). Also, Purkinje cells express Gabra4 and Gabrb1, which have not been reported in Purkinje cells previously. We also showed that the sum of expression levels of GABA receptor subunits was higher than that of glutamate receptor subunits (ionotropic glutamate:GABA = 1:1.4; metabotropic glutamate:GABA = 1:1.7). Because this ratio between glutamate and GABA receptors in Purkinje cells was opposite of that in the hippocampal principal cell layers (ionotropic glutamate:GABA = 1.2:1 – 1.6:1; metabotropic glutamate:GABA = 1.5:1 – 3:1), Purkinje cells are likely to increase the sensitivity of GABA inputs in contrast to hippocampal principal neurons.
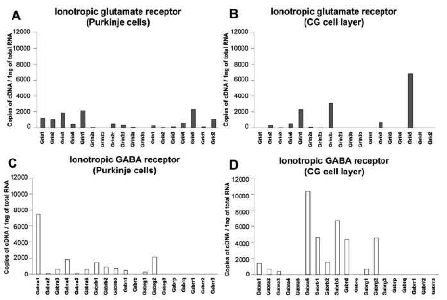
Figure 1. Quantification of gene expression levels by real-time qPCR with genes coding for ionotropic glutamate and GABA receptors in Purkinje cells (A, C) and the CG cell layer (B, D). Bar plots show expression levels of ionotropic glutamate receptor subunits (18 genes in A, B), ionotropic GABA receptor subunits (19 genes in C, D).
Although Purkinje cells have been believed to lack functional NMDA receptors as observed by most of rat studies, recent studies showed that mouse Purkinje cells have functional NMDA receptor subtypes, suggesting that this is a possible species difference and that Purkinje cells slightly contain Grin2a, Grin2b, and Grin2d, as well as Grin1, in adult mice. Meanwhile, Grin2c has long been believed not to be expressed in Purkinje cells. We demonstrated that Purkinje cells express Grin2c, which is more than Grin2d. We proposed that Grin2c is another candidate subunit to produce functional NMDA receptor subtypes in Purkinje cells of adult mice.
We found that Purkinje cells express several subunits of kainate and GABAA receptors, Grik5, Gabra4, Gabrb1 and Gabrd, which have not been reported in Purkinje cells previously. Together with NMDA receptor subunits described above, these findings suggest novel potential subtypes of functional kainate and GABAA receptors in Purkinje cells.
We also demonstrated the gene expression patterns of “neural communication system” components of cerebellar granule cell layer by qPCR (partly shown in Fig. 1 B and D) and compared with these of Purkinje cells. These quantitative expression data clearly showed the difference of gene expression patterns between Purkinje cells and the CG cell layer and the different expression pattern of these genes may reflect the different function between Purkinje cells and CG cells.
Activity-dependent gene expression means modulation of gene expression occurring in individual cells as a result of various stimuli. It is thought to be correlated with self-reorganizing activities of the nervous system such as neuronal plasticity.
Whole gene analysis was carried out to identify activity-dependently induced genes in a time dependent manner from 0 to 24 hrs by DNA microarray using primary culture of mouse hippocampal cells and cerebellar granule cells. We used forskolin (activator of adenylate cyclase), PMA (activator of protein kinase C) which could mimic the activation of signal transduction cascades induced by neural inputs. By the application of protein synthesis inhibitors, we can distinguish primarily induced genes and secondarily induced genes. For example, EGR1 is activated and decayed quickly by the stimuli of forskolin and PMA. Because EGR1 expression is not inhibited by protein synthesis inhibitors, it is a primarily induced gene. Neuropeptide Y (NPY) gene is induced by either forskolin or PMA. NPY is a secondarily induced gene, because protein synthesis inhibitors inhibited NPY gene expression induced by forskolin and PMA. We obtained these kinds of information for about 2,000 inducible genes. This large amount of data is being analyzed. This data stock should give us basic information to study activity-dependent gene expression.
Locally produced neuromodulators in the hippocampus have important roles in regulating neuronal activity and synaptic plasticity of the principal neurons. As suggested in our previous findings, “the neuropeptidergic system” might promote a diversity of the signal transmission regulations in the hippocampus. In particular, cholecystokinin (CCK) is the mostly expressed neuropeptide gene and represents 66% of all neuropeptides expressed in the CA1 and CA3 regions. It is known that CCK octapeptide sulfated, the active form of CCK, transiently modulates electrophysiological properties of hippocampal neurons in different fashions: i) CCK facilitates depolarization on parvalbumin-expressing basket interneurons; and ii) CCK inhibits depolarization on CCK-expressing basket interneurons via retrograde endocannabinoid (eCB) actions from the principal neurons. Thus, CCK may be a transient modulator having two opposite aspects of excitation and inhibition in the hippocampus.
Besides an action potential on the cell membrane of neurons, gene expression is another major output signal by integrating input signals on neurons. Action potentials are immediate ion transmissions on a time scale of milliseconds, whereas activity-dependent genes are subsequent modulators underlying neuronal activity and synaptic plasticity on a time scale of minutes or even hours and days. Inducible genes on the time scale of minutes, called immediate-early genes (IEGs; e.g. Fos, Egr1/zif268, and Arc), are identified as critical indicators of a neuronal activity and useful for a functional mapping in the cerebral cortex.
Using IEG expression analysis, we have investigated gene regulation by CCK in the hippocampus. We found that CCK-CCKBR signaling increases the activity and IEG expression in a neuronal cell line, as mentioned previously. Then, we extraneously applied CCK into living hippocampal slices in different active conditions to understand CCK regulatory function in hippocampal networks. Unexpectedly, CCK suppressed cAMP-induced IEG expression in living hippocampal slices through CCKB receptor activation (Fig. 2 A, B). We observed that CCK suppression of cAMP-dependent IEG expression could be recovered by antagonists for GABABR and/or CB1R (Fig. 2 C, D), which are GiPCRs. Furthermore, GABABR and/or CB1R agonists induced the suppression of cAMP-dependent IEG expression. The two GABABR subunits GABAB1a/bR and GABAB2R are expressed presynaptically and postsynaptically on both principal neurons and interneurons in the hippocampus, whereas CB1R is expressed on the presynaptic domain of both excitatory and inhibitory terminals. CCK facilitates GABA release on parvalbumin-containing interneurons. Meanwhile, CCK-CCKBR activation produces eCB from the principal neurons in the hippocampus. Although it is tempting to predict that release of GABA and eCB might suppress cAMP-induced IEG expression via GABABR and/or CB1R activation, further work is necessary to elucidate detail mechanism and the physiological meaning of CCK suppression of cAMP-dependent IEG expression in hippocampal networks.
Our findings using gene expression analysis suggest potential extracellular regulatory machinery in hippocampal networks, and offer an approach complementary to electrophysiological studies.
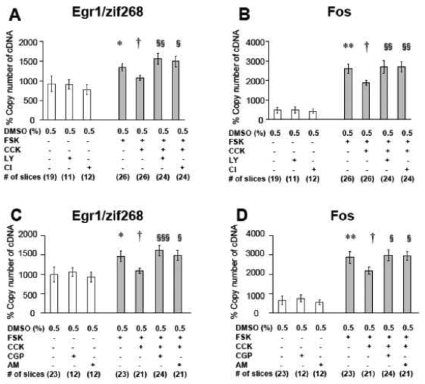
Figure 2. Receptor-antagonist effects on CCK suppression of forskolin-induced IEG expression. A, B. Bar-plots show CCK (1 μm) suppression of forskolin (10 μm)-induced expression of EGR1/zif268 (A) and FOS (B). This suppression is recovered by CCKB receptor antagonist LY225910 (LY, 1 μm) or Cl988 (Cl, 1 μm). C, D. Bar-plots show CCK suppression of forskolin-induced expression of EGR1/zif268 (C) and FOS (D). This suppression is recovered by GABAB receptor antagonist CGP55845 (CGP, 1 μm), or CB1 receptor antagonist AM251 (AM, 10 μm).
3.2 Mass spectrometric analysis for the study of the nervous system
3.2.1 Sampling and analysis of brain fluids for finding new neuroactive moleculesNeuroactive compounds (peptides, monoamines, lipids etc.) are important signal molecules for intercellular communication and play significant roles in animal behavior and physiology. To study their dynamics in living brain, it is necessary to deploy sensitive tools for their sampling, detection, and identification. Microdialysis is a widely used research tool for sampling molecules of interest (such as neurotransmitters, peptides, proteins, drugs and its metabolites) from the extracellular space in vivo and it has broad applications from basic research to clinical usage. However, a high recovery of peptides by microdialysis has not been achieved yet. To overcome recovery problem we devised a high recovery microsampling probe based on microdialysis. Using the new probe and the conventional microdialysis probe, we collected brain fluid from free living rats.
Mass spectrometry is a sensitive method for detection and identification of trace amount neuroactive molecules released from the nervous system. We have collected brain fluids from the different parts of the rat brain and are analyzing by Nano-mass spectrometry (collaboration with Hiroshima University).
An experimental model animal, salamander (Ambystoma mexicanum), was selected to identify and visualize phospholipids in the retina section. Due to the salamander’s large cells and a relatively simple nervous system, we envisage that it could be a suitable model animal for a single cell imaging mass (IMS) study. As shown in Fig. 3 (inset), the salamander retina section has a similar basic structural organization with that of the mouse. Retinal pigment epithelium (RPE), outer segment and inner segment (OS & IS), outer nuclear layer (ONL), outer plexiform layer (OPL), inner nuclear layer (INL), inner plexiform layer (IPL), and ganglion cell layer (GCL) are easily recognized. In addition, the salamander retinal cells (average diameter 14.5 μm) are larger than that of the mouse (average diameter 6.5 μm), and every layer contains fewer cells than the mouse retinal layer. The salamander retina having large cells and an atmospheric pressure (AP) MALDI IMS system (collaboration with Shimadzu Corporation, Kyoto) having a more focused laser beam (10 μm) enabled us to identify phospholipids at cellular size resolution. AP MALDI MS instrument was equipped with a high resolution optical microscope that facilitated observation and selection of the target area of tissue samples for accurate analysis. Electrospray ionization (ESI) MS analyses of the salamander retina lipid extract also provided a complementary lipid profile (Fig. 4, collaboration with Taguchi Lab, Tokyo University).
Salamander large cells facilitated identification and localization of lipids by MALDI imaging mass spectrometry. Salamander retina lipid extract showed similarity with rodent retina lipid extract in phospholipid content and composition (Fig. 4). Like rodent retina section, distinct layer distributions of phospholipids were observed in the salamander retina section. Phosphatidylcholines (PCs) composing saturated and monounsaturated fatty acids (PC 32:0, PC 32:1, and PC 34:1) were detected mainly in the outer and inner plexiform layers (OPL & IPL), whereas PCs containing polyunsaturated fatty acids (PC 36:4, PC 38:6, and PC 40:6) composed the inner segment (IS) and outer segment (OS). The presence of PCs containing polyunsaturated fatty acids in the OS layer implied that these phospholipids form flexible lipid bilayers, which facilitate phototransduction process occurring in the rhodopsin rich OS layer. Distinct distributions and relative signal intensities of phospholipids also indicated their relative abundance in a particular cell or a cell part (Fig. 2). Using salamander large cells, a single cell level localization and identification of biomolecules could be achieved by MALDI imaging mass spectrometry.
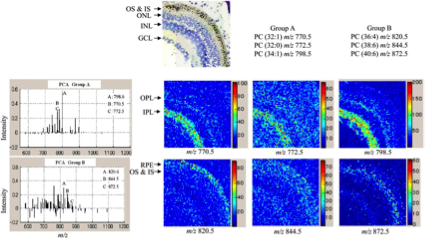
Figure 3. Image reconstruction of phospholipids distribution in the salamander retina section. PC 32:0, PC 32:1, and PC 34:1 are distributed in the OPL and IPL layers; PC 36:4, PC 38:6, and PC 40:6 are distributed in the IS, OS, and RPE layers. Inset is an optical image of salamander retina section. Raw intensity was used. Inset: An optical image of a salamander retina section visualized by toluidine blue staining after MALDI imaging mass data acquisition: RPE, retinal pigment epithelium; OS, outer segment; IS, inner segment; ONL, outer nuclear layer; OPL, outer plexiform layer; INL, inner nuclear layer; IPL, inner plexiform layer; GCL, ganglion cell layer. Frozen section, 5 μm.
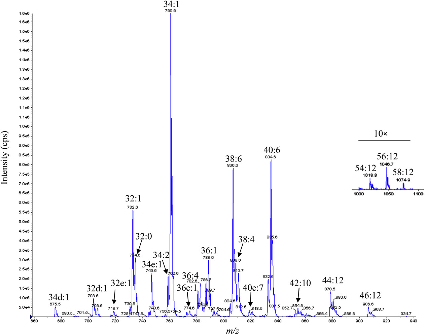
Figure 4. Phospholipids contents of the salamander retina lipid extract by LC infusion (precursor ion scan ESI positive mass spectrum, The number (say 32:0) indicates total carbon composition and unsaturation of fatty acids in a lipid.).
3.3 Salamander project
3.3.1 cDNA sequencingBecause salamander has larger cell size and higher DNA and RNA content per cell compared to other model organisms, it could be an ideal animal for single-cell level gene expression analysis. But little genetic information has been accumulated for this animal. We previously sequenced about 12,000 representative salamander cDNA clones from cDNA libraries of the brain, retina, and spinal cord of the salamander (Ambystoma mexicanum) by primer walking method. In FY2010, we have assembled and manually edited the full-length sequences of about 6,000 clones. Full-length sequences were analyzed and annotated by Blastx search and 110 genes coding for "the neural communication system" components were identified (Table 1).
To know the accuracy of forward sequences, additional reverse sequencing was performed for 122 forward sequenced clones (mainly "the neural communication system" component genes). Forward sequences showed 99.9% (average) identity to the confirmed sequences obtained by both strand sequencing. Two clones showed worst identity scores of 96% and 95%.The results showed high reliability of assembled sequence with forward sequencing.
Amino acid sequences of salamander's "the neural communication system" components were compared to those of human. Fig. 5 shows the identity score (% of identity positions) between salamander and human sequence for each gene in each group of "the neural communication system" orthologs. Ligand-gated ion channel, neurotransmitter synthase, and voltage-gated ion channel group are highly conserved (over 75% in median value). GPCR group showed broad distribution (34-98%) and its distribution significantly different from that of ligand-gated ion channel (p0.05, Steel-Dwass). Neuropeptide group showed relatively low identity (mainly less than 60%) and its distribution differed significantly from other groups (p0.05).
Table 1. "The neural communication system" component genes found in salamander cDNA libraries.
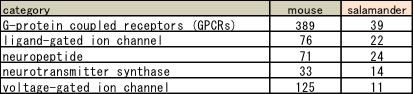
In about 6,000 full-length sequenced clones, 110 clones were identified as "the neural communication system" component genes. In mouse database, 694 genes were classified into the group.
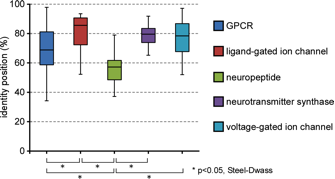
Figure 5. Identity scores of amino acid sequences of each gene group. Many of the clones showed over 75% identity to human amino acid sequences in ligand-gated ion channel, neurotransmitter synthase and voltage-gated ion channel group. GPCR group showed broad distribution. Neuropeptide group showed relatively low identity and its distribution differed significantly from other groups. Asterisks indicate p0.05 by Steel-Dwass.
Further sequence analysis was carried out. For example, we compared salamander neuropeptide Y (NPY) preproprotein with human NPY preproprotein (Fig. 6). The mature NPY is cleaved from the preproprotein. The mature NPY sequence of human (biologically active 36 amino acids) was very similar to the homologous part of salamander NPY (identity position 91.7%, consensus position 94.4%), but the signal peptide (identity position 54.8%, consensus position 64.5%) and the calboxy-terminal part didn’t have such high similarity. This feature was also seen in NPY preproproteins of other species (mouse, chicken, frog and fish). We also compared salamander glutamate receptor (GRIK2) with human's. Similarity in signal peptide (31 amino acid) was also low (identity position 51.6%, consensus position 71.0%) but the 877 long amino acid sequence of mature peptide had very high similarity (identity position 95.0%, consensus position 97.3%).
We showed that the salamander amino acid sequences (particularly for the functional parts of "the neural communication system" components) are very homologous to human and the other species sequences. This indicates that salamander could be a good model organism for the molecular neuroscience research.
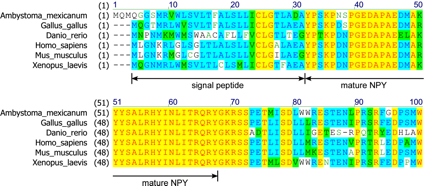
Figure 6. Multiple-alignment of neuropeptide Y preproprotein amino acid sequences of 6 different species. Mature NPY sequence is highly conserved among species (chichen (Gallus gallus), zebrafish (Daniorerio), mouse (Mus musculus) and frog (Xenopus laevis) ), but the signal peptide and the other part are not. [Color of aligned amino acids; black text and white background = non-similar, blue text and light-blue background = conservative, black text and green background = block of similar, red text and yellow background = identical, green text and white background = weakly similar.]
3.3.2 Gene expression analysis at single-cell level We have investigated a method system for single-cell analysis, including collection of single cells, RNA sampling from single cell, amplification of cDNA, quantification of cDNA by qPCR, etc. In FY2009, we carried out a preliminary experiment using 33 retinal ganglion cells and 35 gene markers and showed the possibility of classification of cell types by single-cell gene expression analysis. In FY2010, we have improved the method system. For example, we made a method for the precise determination of RNA amount in small scale of samples collected from single-cells by measuring the copy number of rRNA and have studied amplification step of cDNAs. We will plan to start a full dress study of single-cell gene expression analysis using salamander neurons.
4.1 Journals
- Nakamura, N., Akiyama, K. & Naito, T. Suppression of cAMP-dependent gene expression by cholecystokinin in the hippocampus. Neuroscience (in press).
- Nakamura, N. H., Akiyama, K. & Naito, T. Quantitative gene expression analysis of the ligand-receptor system for classical neurotransmitters and neuropeptides in hippocampal CA1, CA3 and dentate gyrus Hippocampus, doi:10.1002/hipo.20830 (2010).
- Roy, M. C., Ikimura, K., Nishino, H. & Naito, T. A high recovery microsampling device based on a microdialysis probe for peptide sampling. Anal Biochem 399, 305-307, doi:S0003-2697(09)00883-5 [pii] 10.1016/j.ab.2009.12.036 (2010).
- Roy, M. C., Nakanishi, H., Takahashi, K., Nakanishi, S., Kajihara, S., Hayasaka, T., Setou, M., Ogawa, K., Taguchi, R. & Naito, T. Salamander retina phospholipids and their localization by MALDI imaging mass spectrometry at cellular size resolution. Journal of Lipid Research 52, 463-470. (2010).
4.2 Books and other one-time publications
- Hayasaka, T. Naito, T. & Setou, M. Application of imaging mass spectrometry to photobiology. Photobiology, 243-250 (2010).
4.3 Oral and Poster Presentations
- Araki, M., Akiyama, K. & Naito, T. Sequence analysis of the "neural communication system" related genes of salamander., BMB2010, Kobe Portisland, Kobe City, Dec 7-10, 2010
- Nakamura, N., Akiyama, K. & Naito, T. Suppression of cAMP-dependent gene expression in the hippocampus by cholecystokinin and extracellular regulatory machinery, Neuro 2010, Kobe Convention Center, Kobe, Japan, Sep 2-4, 2010
- Nakamura, N., Akiyama, K. & Naito, T. Overall and quantitative gene-expression analysis of mouse Purkinje cells, BMB2010, Kobe Portisland, Kobe City, Dec 7-10, 2010
5. Intellectual Property Rights and Other Specific Achievements
Nothing to report.
6. Meetings and Events
6.1 Seminar
- Date: June 15, 2010
- Venue: IRP Conference Room
- Speakers: Karl-Heinz Herzig, Institute of Biomedicine and Biocenter of Oulu, Oule University
- Title: Gut brain interaction and regulation of energy homeostasis
6.2 OIST Special Lecture
- Date: June 23, 2010
- Venue: OIST Campus, Seminar Room B250
- Speakers: Shigetada Nakanishi, Osaka Bioscience Institute
- Title: Information processing and integration of the basal ganglia