


nru FY2011 Annual Report 3

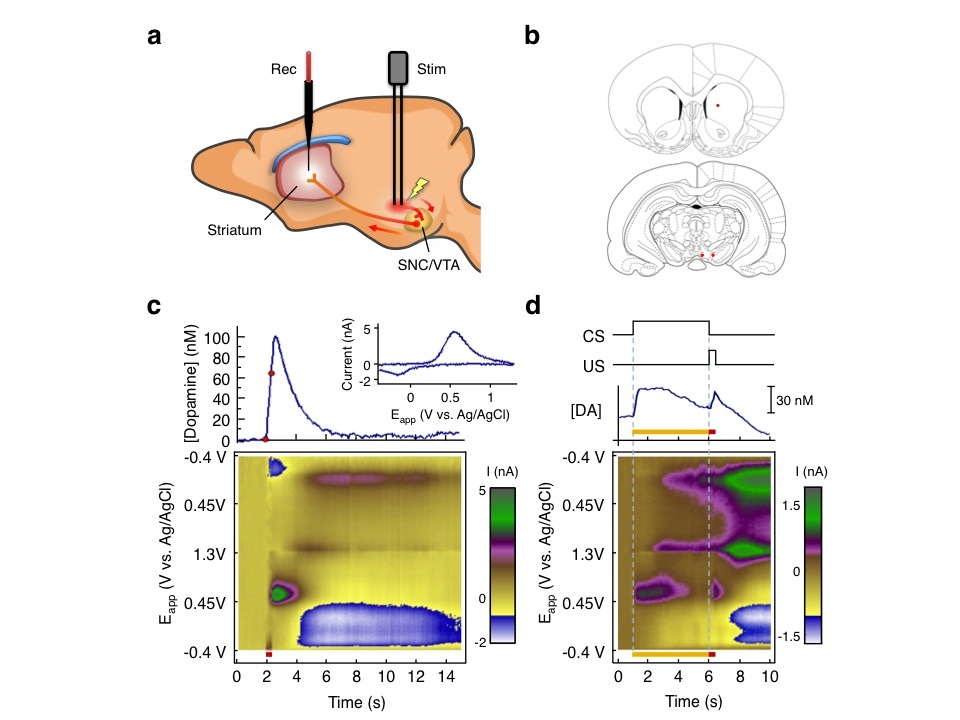
Fig 2: Overview of FSCV studies. A. Dopamine neurons were electrically stimulated (stim). Dopamine was measured at a probe (Rec) in the striatum. B. Electrode target locations.44 C. Background-subtracted current intensity represented by a color scale45 plotted against time and command potential. Dopamine response to electrical stimulation (red bar) shown. Graph above shows dopamine concentration. Red dots show onset and offset of stimulation. Inset shows voltammogram at peak response. D. Acquired dopamine response to sound (conditioned stimulus, CS, yellow bar) paired with electrical stimulation of dopamine cells (unconditioned stimulus, US, red bar).
Copyright OIST (Okinawa Institute of Science and Technology Graduate University, 沖縄科学技術大学院大学). Creative Commons Attribution 4.0 International License (CC BY 4.0).


