


ncu FY2013 Annual Report 15

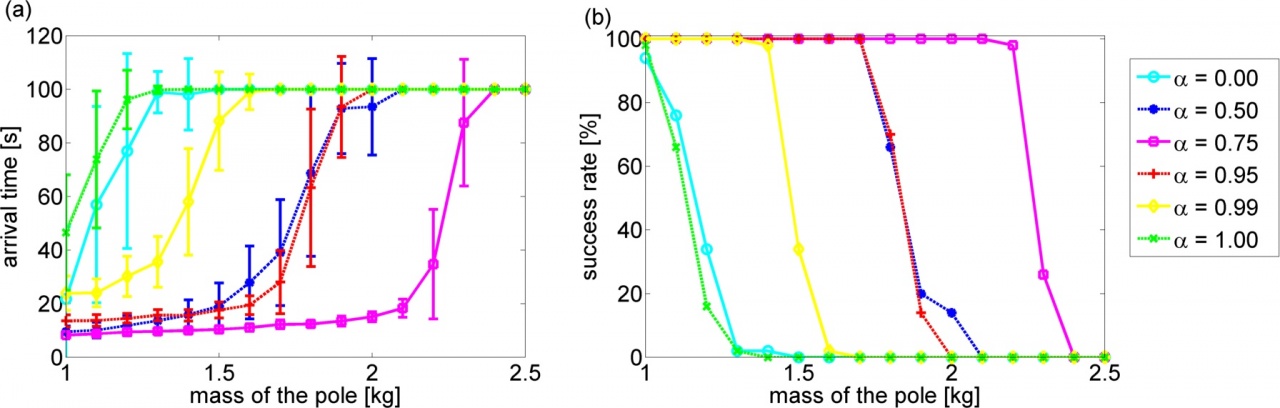
Figure 3.3.3: (a): Arrival time to the desired state. (b): Success rate of swing-up. In each plot, alpha represents the robustness parameter and the horizontal axis is the mass of the pole in test condition.
Date:
04 March 2024
Copyright OIST (Okinawa Institute of Science and Technology Graduate University, 沖縄科学技術大学院大学). Creative Commons Attribution 4.0 International License (CC BY 4.0).
Share on:


