


g0 FY2020 Annual Report Figure 3

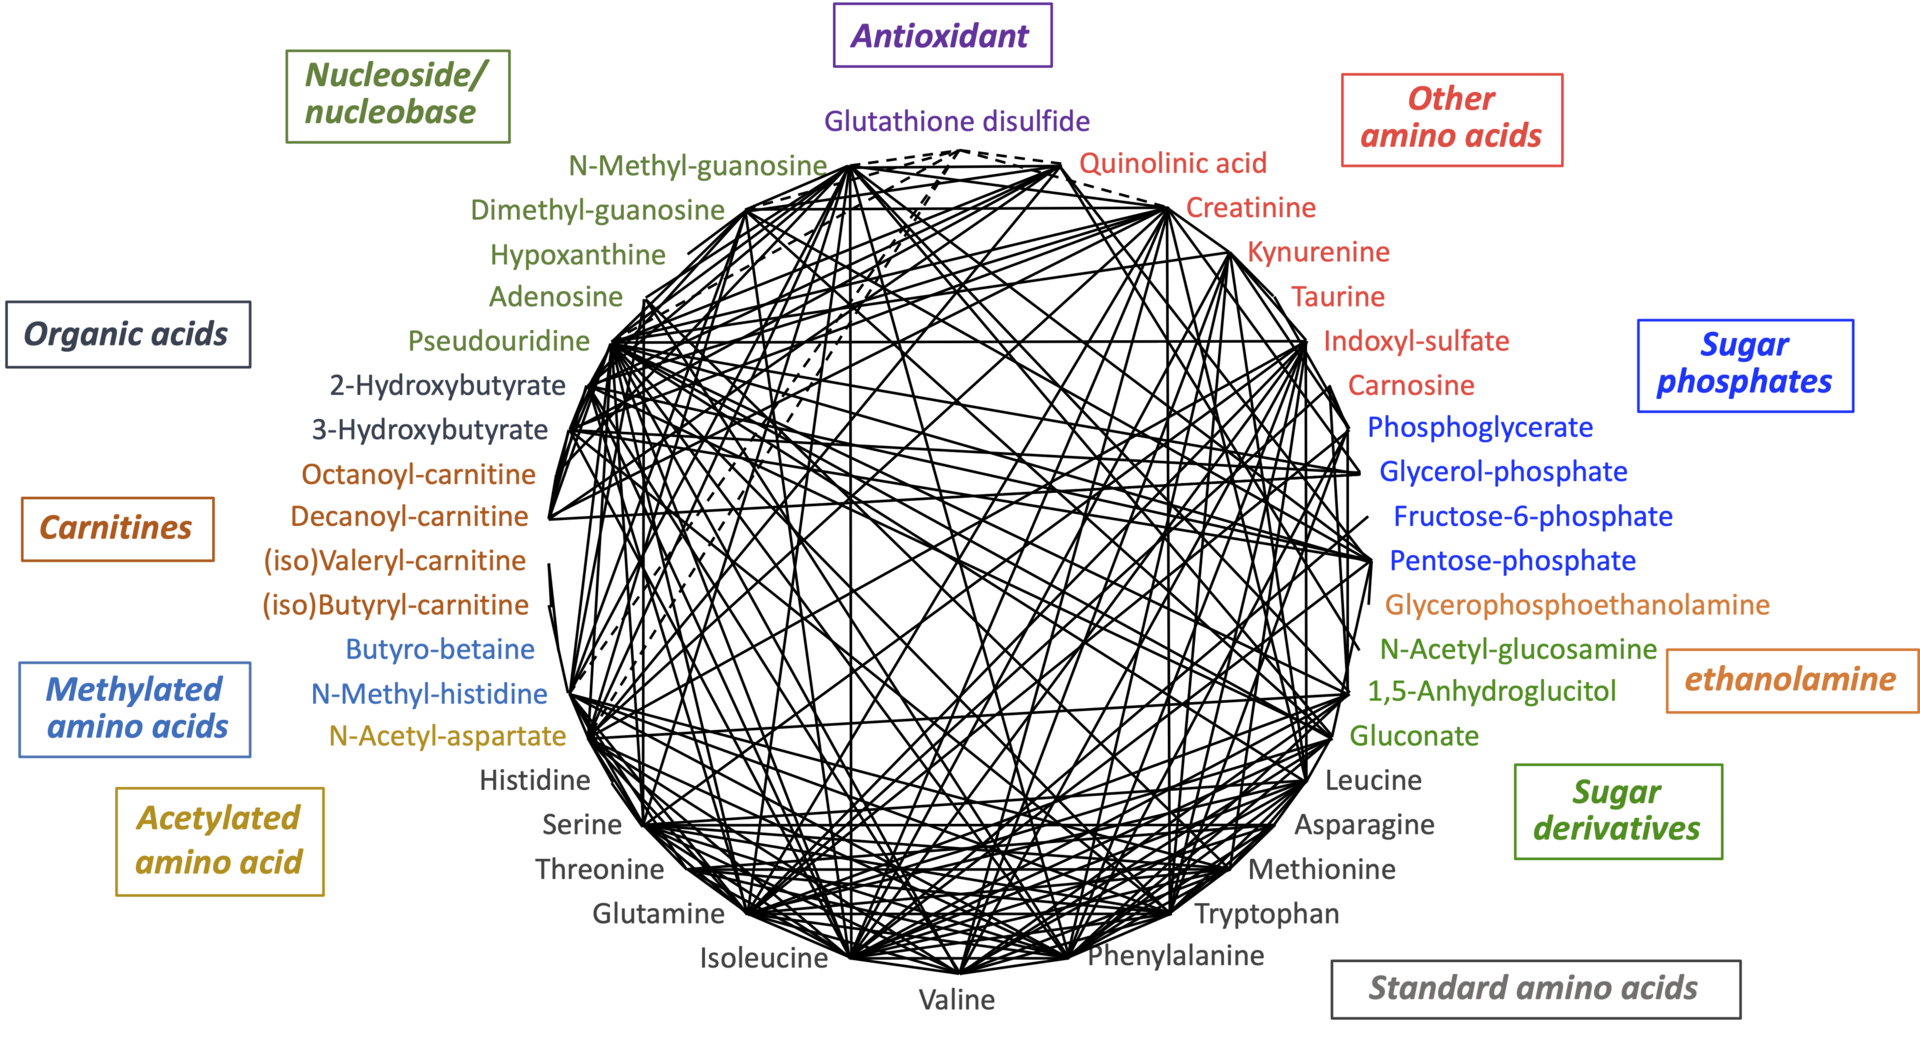
Figure 3. Forty-three of 55 aging markers showed correlations with r values >0.7. Positive and negative correlations are shown with solid and broken lines, respectively. Compounds are sub-grouped in boxes.
Date:
28 February 2024
Copyright OIST (Okinawa Institute of Science and Technology Graduate University, 沖縄科学技術大学院大学). Creative Commons Attribution 4.0 International License (CC BY 4.0).
Share on:


