


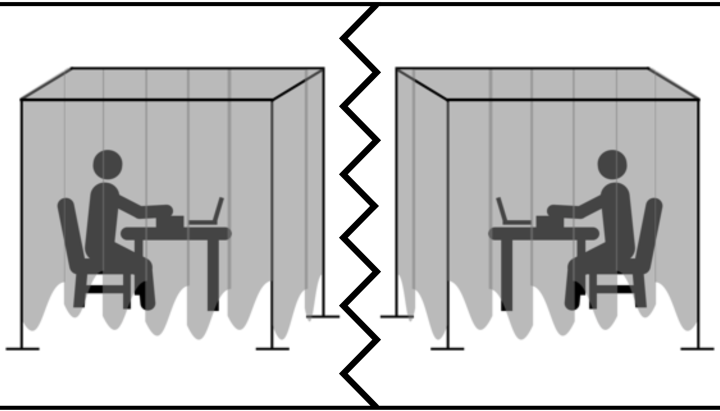
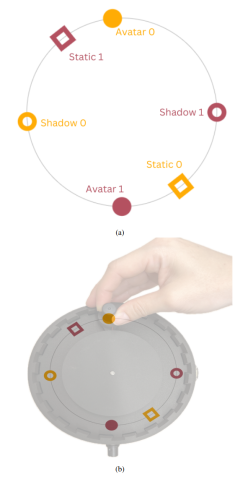
The biggest drawback of previous iterations is the lack of an immediate feedback for the user of their actual movements in the non-visible space. The current PCD offers a circular shape and a knob on a rotating arm that allows the exploration of the space such that participant’s movements are mapped with the avatars’ movements within the circular virtual space and the avatars move at the same speed as the spinning knob. Additionally, the tactile feedback area in previous versions of the PCD was limited to the non-moving hand and to a rather small surface on the hand. The updated PCD offers a tactile feedback for both hands through the moving handle and the button-pressing handle. Furthermore, the implementation of the button-pressing handle increases the area of vibratory feedback considerably as it covers approximately two thirds of the palmar surface. In addition to tactile feedback, the current PCD offers audio feedback as well for use in situations where haptic feedback is not desired, giving options to the operator on how to perceive their interaction.


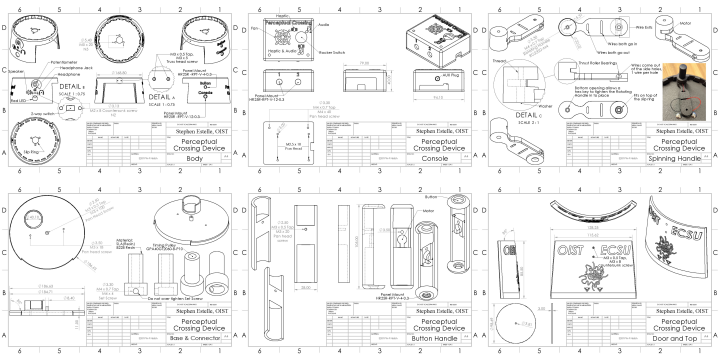
The 3D printed parts, including the controller’s main body, base, top cover plate, door, and handles, are fabricated from 3201PA-F Nylon using Selective Laser Sintering (SLS) technology, ensuring precise, lightweight, and durable components. However, the coupling part was 3D printed from Stereolithography (SLA) 3D printed resin for precision and extra durability.
The circuitry of the PCD is designed with an emphasis on simplicity, reproducibility, and ease of distribution. Within this framework, the Linear Resonating Actuators (LRA) are configured to generate vibrations following a square wave pattern at a frequency of 220 Hz. This specific frequency, as opposed to the resonant frequency of 235 Hz, is selected to minimize extraneous noise emissions when the motors are operational in conjunction with the Adafruit Audio Amplifier.

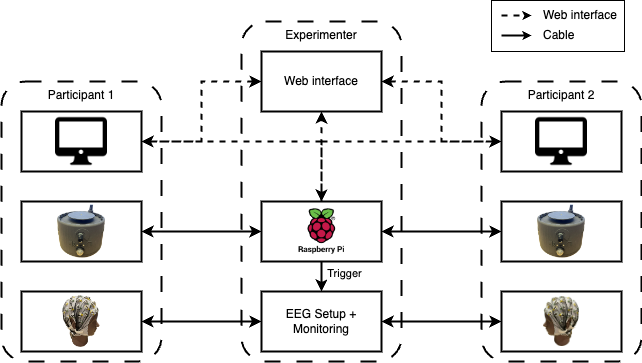
The software framework of the PCD System is a critical component that enables seamless interaction and data processing. A schematic of the system with its various components is shown below. The Raspberry Pi in the center of the architecture runs the Python 3.9 scripts. The software leverages libraries such as pandas, scipy, gpizero, and pigpio for efficient data handling and GPIO (General Purpose Input/Output) control which is used for the communication with the two actual PCD.

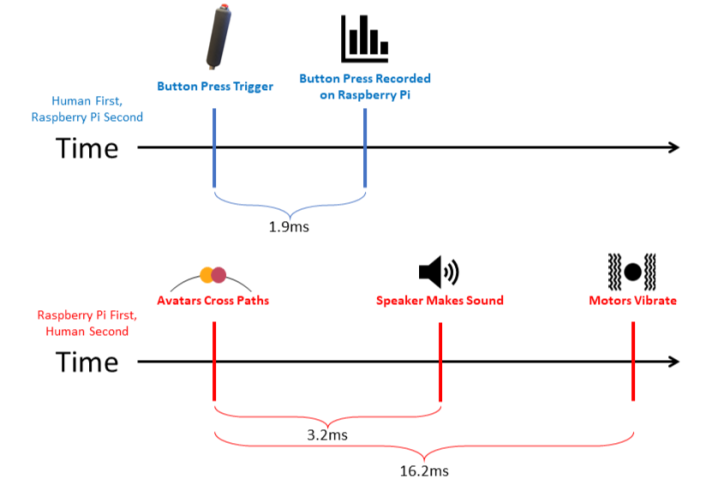
The conducted validation tests on the PCD have affirmed its accuracy and efficacy. These tests demonstrate that the device can provide near real-time feedback, with the haptic motors and audio stimuli exhibiting average delays of 16.2 ms and 3.2 ms, respectively. This temporal precision is critical for researchers and practitioners conducting trials using the PCD. Furthermore, the device’s button-press mechanism effectively captures the moment of perceived presence between users, evidenced by an average delay of only 1.9 ms. Despite the encoder’s limitation to a resolution of 1024 pulses/revolution (equivalent to 1 pulse per 0.35 degrees), the high sampling rate of approximately 494.6 Hz ensures accurate tracking of an individual’s position throughout the experiment.
The full PLOS One Journal article can be viewed and downloaded here. Instructions on putting together the PCD can all be found here. This includes 3D CAD files, circuit board files, software downloading instructions, as well as the build of material.