


qsu FY2021 Annual Report 09

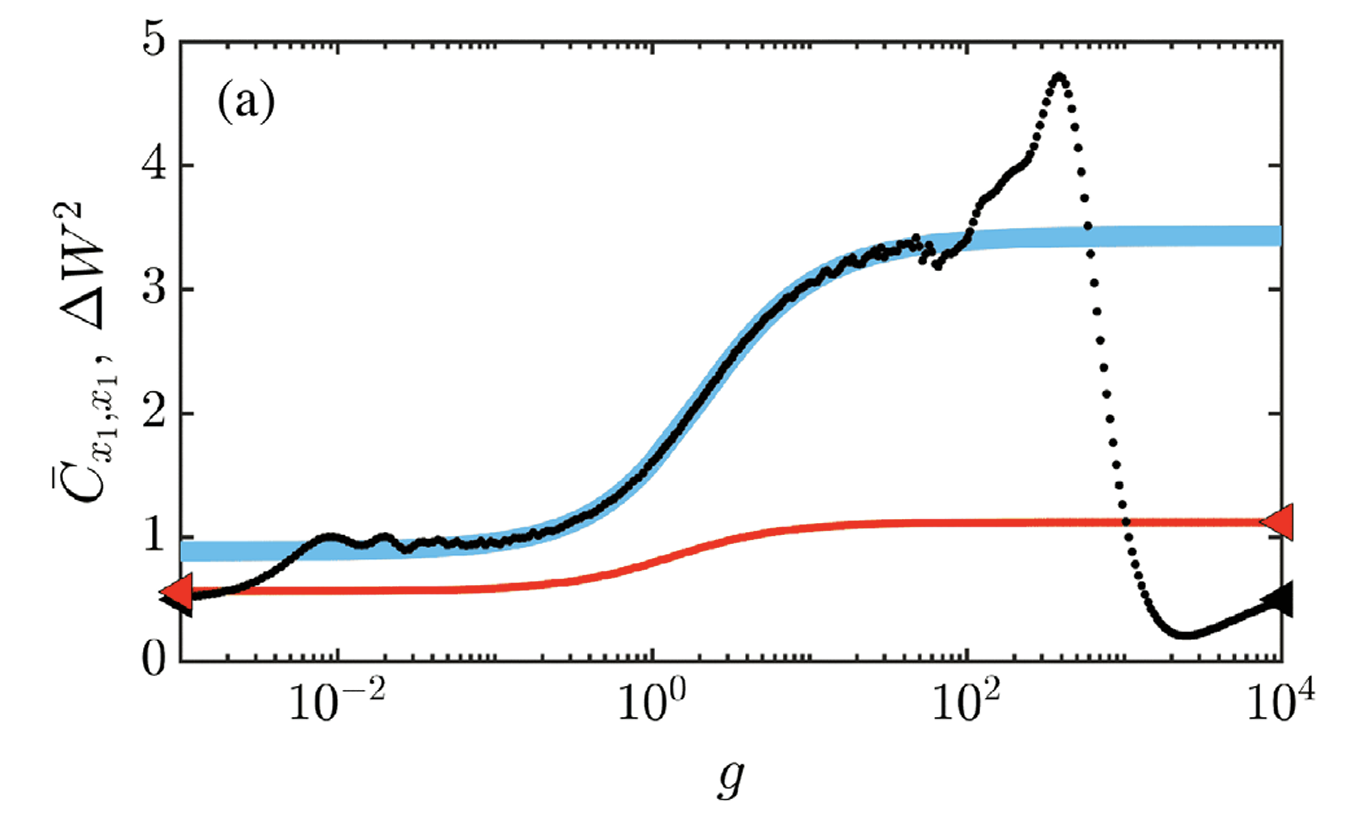
Figure: The full blue line is the infinite-time average of the squared commutator Cx1,x1 as a function of g for γ=1/2. Black dots show the time average of the same squared commutator in an interval t∈[0,200π] as a function of g. The variance of the work distribution function ΔW2 is given by the red solid line. The triangles correspond to the g=0 and g=∞ values of Cxx (black) and ΔW2 (red).
Publication:
Connecting scrambling and work statistics for short-range interactions in the harmonic oscillator
M. Mikkelsen, T. Fogarty, and Th. Busch
Phys. Rev. Lett. 128, 070605 (2022)
Date:
11 March 2024
Copyright OIST (Okinawa Institute of Science and Technology Graduate University, 沖縄科学技術大学院大学). Creative Commons Attribution 4.0 International License (CC BY 4.0).
Share on:


