


qsu FY2018 Annual Report 06

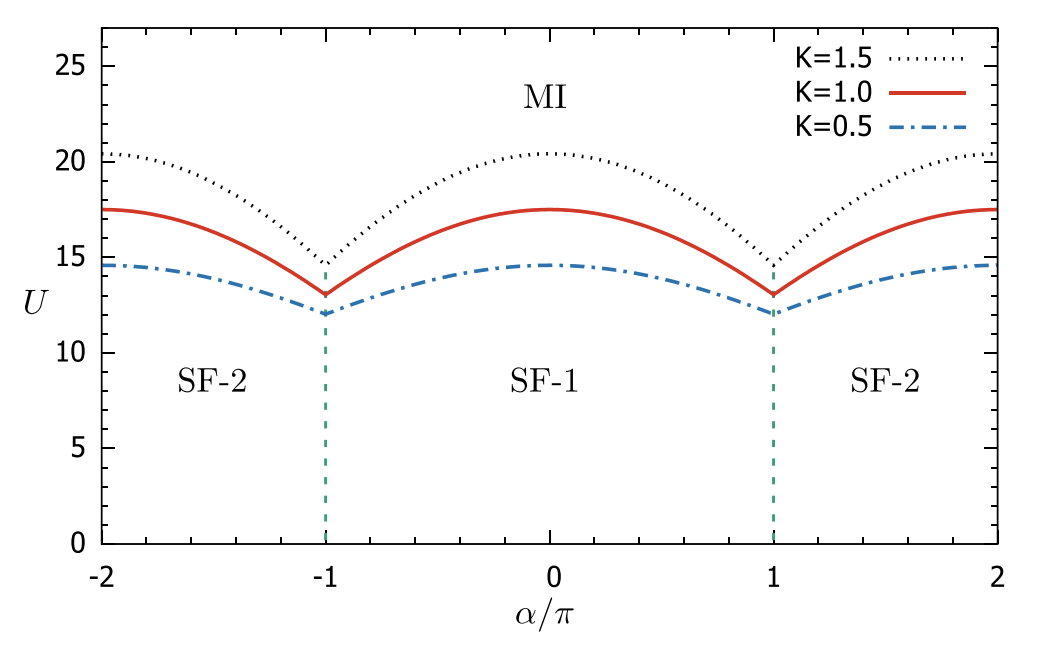
Figure: Phase diagram for the two-leg ladder Bose-Hubbard model in the presence of a staggered flux of magnitude α for unit filling factor using Landau theory. The solid (red) curve marks the boundary between the Mott-insulator and the different superfluid phases for K = J = 1.0. The region below the solid (red) curve comprises of two types of superfluids, which are separated by green dashed lines. The dashed (blue) lines and dotted (black) lines mark the phase boundaries for J = 1 and K = 0.5 and 1.5, respectively. Here J is the intra-leg and K the inter-leg hopping amplitude.
Publication:
Two-leg-ladder Bose-Hubbard models with staggered fluxes,
R. Sachdeva, F. Metz, M. Singh, T. Mishra, and Th. Busch
Phys. Rev. A 98, 063612 (2018).
Copyright OIST (Okinawa Institute of Science and Technology Graduate University, 沖縄科学技術大学院大学). Creative Commons Attribution 4.0 International License (CC BY 4.0).


