


peu FY2022 Annual Report 3

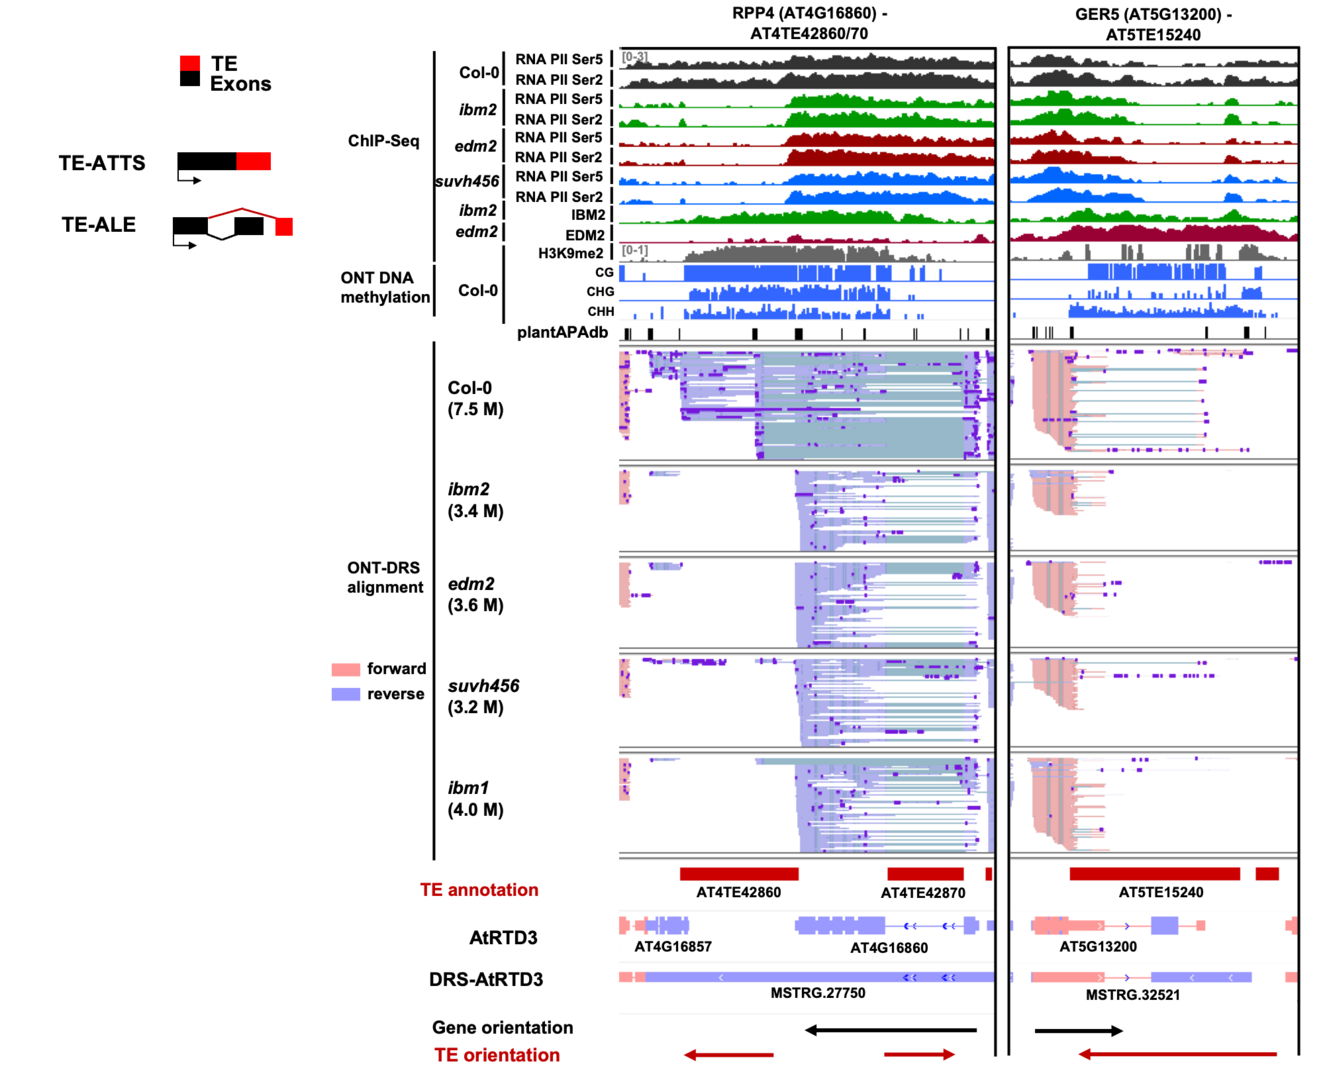
Figure 2. Representative genome loci showing TE-gene isoform production with TE-ATTS events. Tracks (from top to bottom): ChIP-seq data for RNA Pol II phosphorylated at Ser5/Ser2 in CTD repeats (bins per million); ChIP-seq data for IBM2 and EDM2 localization (bins per million); Col-0 ChIP-seq of H3K9me2 (reads per million); methylation levels of Col-0 in CG, CHG, and CHH contexts (0–100%); poly(A) sites obtained from the PlantAPA database; DRS read alignments of Col-0 and indicated mutants; TE and transcript annotations of AtRTD3 and DRS-AtRTD3 in this study and the orientation of genes and TEs.
Copyright OIST (Okinawa Institute of Science and Technology Graduate University, 沖縄科学技術大学院大学). Creative Commons Attribution 4.0 International License (CC BY 4.0).


