


peu FY2021 Annual Report 3

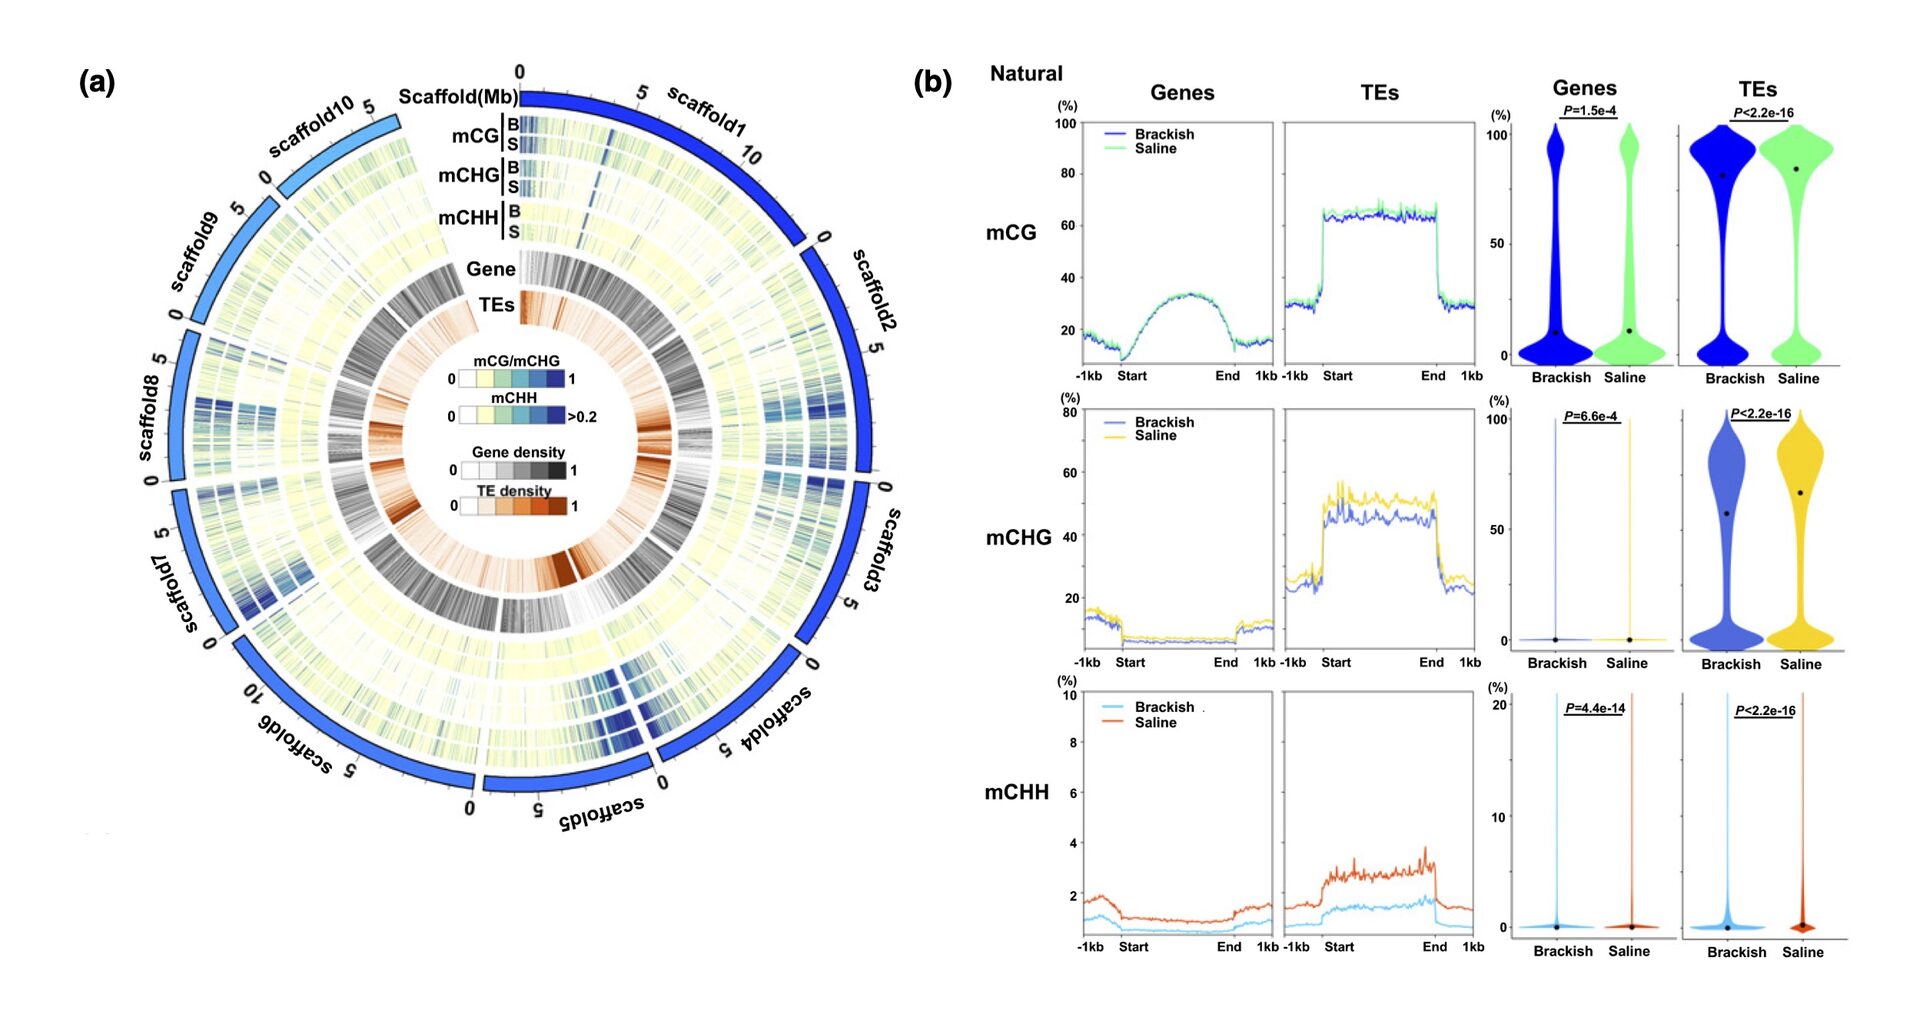
Figure 2. (a) A Circos plot showing cytosine methylation levels of the 10 longest scaffolds (> 5 Mb) of Bruguiera gymnorhiza. The outermost circle shows the 10 scaffolds. The next six circles represent the DNA methylation levels in brackish (B) and saline (S) conditions for CG (0 to 1), CHG (0 to 1), and CHH (0 to 0.2) contexts (H can be A, or C, or T) in the natural environment. The first and second innermost circles show the density of genes (black) and transposable elements (TEs; orange), respectively. (b) (Left) Metaplots of cytosine methylation levels in CG, CHG, and CHH contexts for genes and TEs in brackish and saline conditions in the natural environment. (Right) Violin plots showing levels in CG, CHG, and CHH contexts for genes and TEs in brackish and saline conditions in the natural environment. Figures are adapted from Miryeganeh et al., 2022.
Copyright OIST (Okinawa Institute of Science and Technology Graduate University, 沖縄科学技術大学院大学). Creative Commons Attribution 4.0 International License (CC BY 4.0).


