


peu FY2014 Annual Report 2

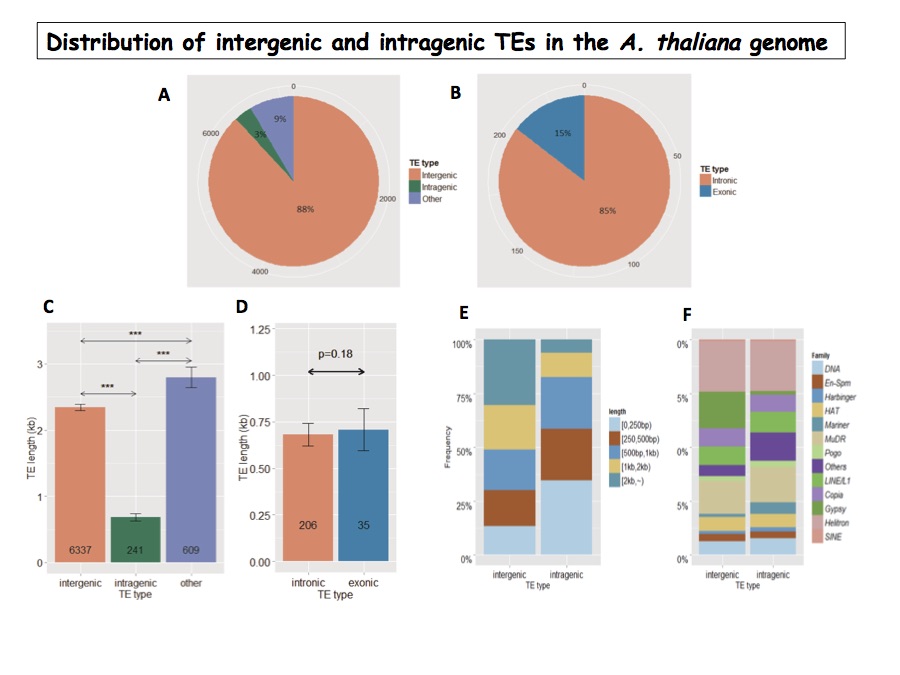
Figure 1: Abundance and classification of all TE (A) and intragenic TEs (B) in the A. thaliana genome. (C)-(F) TE length and family in intergenic and intragenic regions. P-values were given by the Mann-Whitney U test. (***) corresponds to P < 0.0005. Numbers inside bar plots indicate total numbers of TEs in each category. Error bars represent mean ± SE.
Date:
08 March 2024
Copyright OIST (Okinawa Institute of Science and Technology Graduate University, 沖縄科学技術大学院大学). Creative Commons Attribution 4.0 International License (CC BY 4.0).
Share on:


