


onu FY2018 Annual Report 3

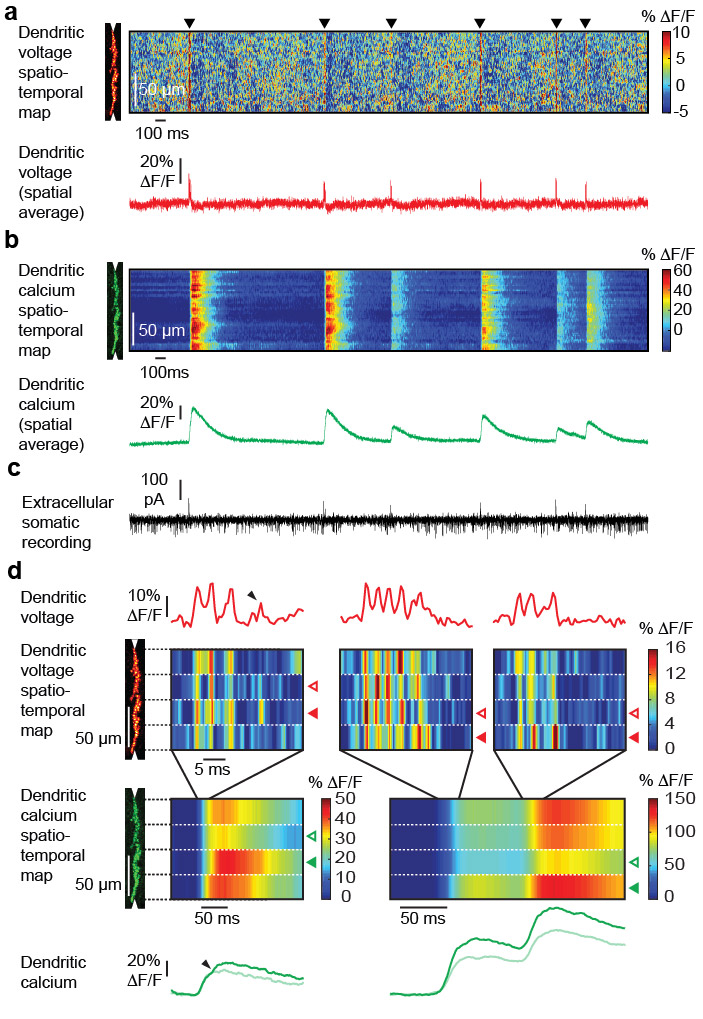
Simultaneous voltage and calcium imaging of Purkinje neuron dendrites and somatic recording in the awake mouse. (a) A line scan at 2 kHz was taken along the Purkinje neuron dendrites (scan position shown in Fig. 3j) to record a voltage spatio-temporal map in an awake mouse. The spatially averaged dendritic voltage (red trace) clearly shows suprathreshold dendritic complex spikes (black triangles). (b) The corresponding dendritic calcium spatio-temporal map and spatially averaged dendritic calcium (green trace) shows large calcium transients for every dendritic complex spike. (c) The access port also allowed simultaneous extracellular electrical recordings from the soma (black trace) while imaging voltage and calcium transients from the dendrites. Simple spikes (somatic Na+ spikes) result in a current sink at the soma, while complex spikes (dendritic Ca2+ spikes) result in a dominant current source signal at the soma. (d) Different parts of the dendritic tree show a different number of spikelets during the same complex spike event. The number of spikelets correlate with the amplitude of the calcium transients in each part of the dendritic tree. Open arrowheads indicate spatially localized low activity, filled arrowheads show high activity. Spatially localized dendritic spikelets during complex spikes correlate with a local boost in the dendritic calcium transient (small arrowheads). (Roome & Kuhn 2018)
Copyright OIST (Okinawa Institute of Science and Technology Graduate University, 沖縄科学技術大学院大学). Creative Commons Attribution 4.0 International License (CC BY 4.0).


