


onu FY2013 Annual Report 14

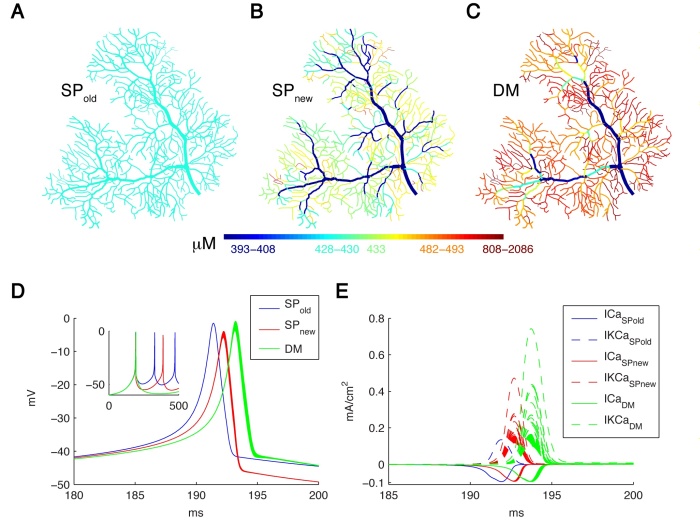
Figure 12: Spatial Ca2+ gradients strongly depend on the type of model implementation. Panels A-C show maps of the integrated calcium levels in the dendrite during a spontaneous burst of Ca2+ spikes (panel D). The dendritic branches are color coded to show the integrated calcium levels using a 20 ms window around the peak Ca2+ concentration of the first dendritic Ca2+ spike. The color scales used in these maps are nonlinear (using histogram equalization) to enhance the contrast. (A) Single Ca2+ pool model using SPold mechanism results in homogenous Ca2+ levels. (B) Single Ca2+ pool model using SPnew mechanism results in variable Ca2+ levels. (C) Detailed Ca2+ dynamics model with buffering and 1D diffusion results in variable Ca2+ levels with larger Ca2+ gradients. (D) Voltage traces show the first spike of the Ca2+ burst for each model in all dendritic compartments for the 3 different models (see color code in Figure). The inset shows complete traces. (E) The underlying Ca2+ and KCa currents (recorded from all dendritic compartments) for the Ca2+ spike of the 3 different models (see color code in Figure).
Copyright OIST (Okinawa Institute of Science and Technology Graduate University, 沖縄科学技術大学院大学). Creative Commons Attribution 4.0 International License (CC BY 4.0).


