


obu FY2015 Annual Report 1

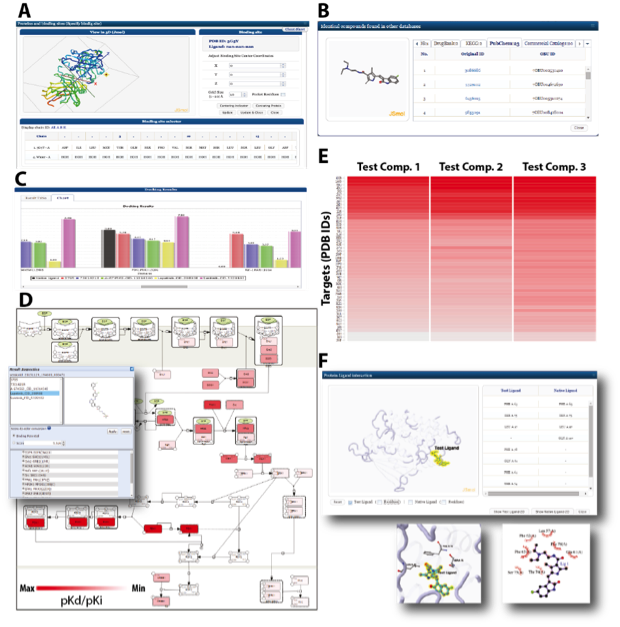
Figure 5-1. Screenshots of the systemsDock web interface. (A) Interactive functions for binding site specifications are accessed by clicking on the displayed protein structure or amino acids listed in the sequence table to define the location of the preferred binding site. Users can adjust x-y-z coordinates to refine the location. (B) Links are provided for the test compound in external databases, as well as to visualize the compound in 3D. (C) Prediction results are furnished in an interactive histogram. Docking scores for each compound are grouped by proteins. By clicking on one of the bars, molecular binding interactions can be graphically shown in 2D/3D for structure-based investigation as shown in (F). (D and E) Visualizing results through a pathway map provided by the user or using a heat map. Colors of proteins are displayed as white-to-red scales or as white and red according to the docking scores. Click on a colored node (i.e. protein) to display binding interactions in 2D/3D as shown in (F). (F) Visualizing protein-ligand binding interactions of the test compound or native ligand in 2D/3D. Protein residues involved in the binding interaction are automatically identified. For reference, those that interacted with a native ligand, if available, are also listed. Clicking on any of the residue entries listed allows users to center and display the specified residue for closer inspection.
Copyright OIST (Okinawa Institute of Science and Technology Graduate University, 沖縄科学技術大学院大学). Creative Commons Attribution 4.0 International License (CC BY 4.0).


