


nnp FY2015 Annual Report 3.3 Figure 1

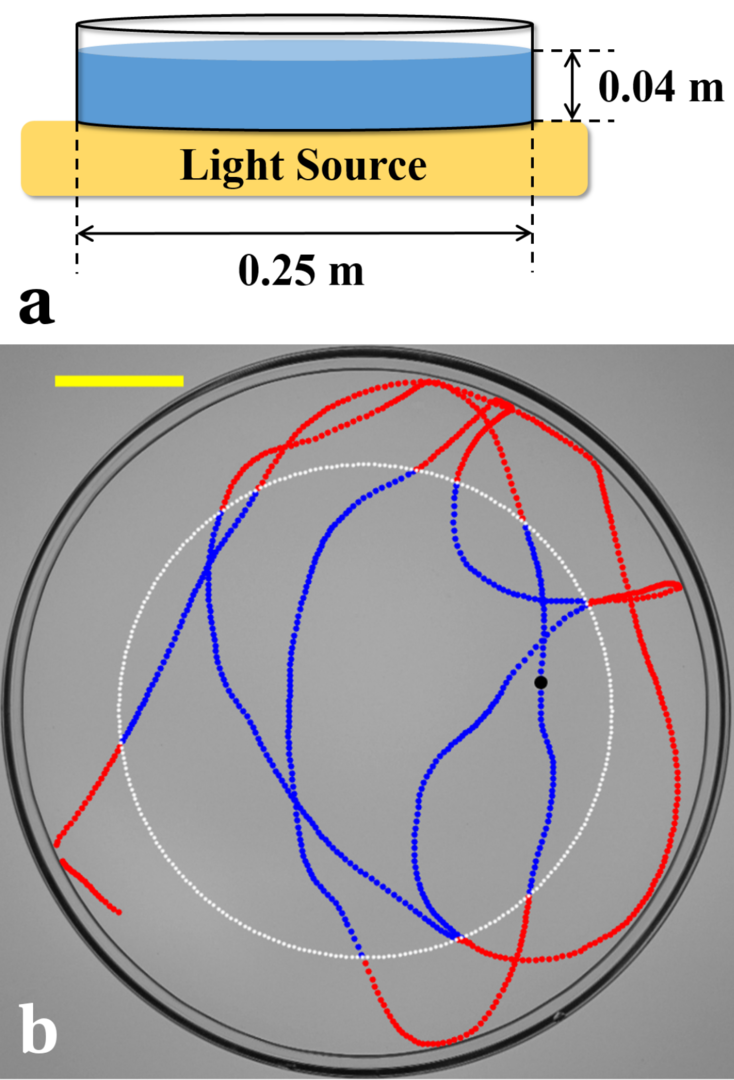
Figure 1: a) Schematic of the experimental setup. b) Trajectory for a single camphoric acid boat. The region within the white dotted line denoting the trajectory in blue is considered for all analysis. The trajectory marked in red is discarded from analysis to avoid systematic errors arising from boundary effects.
Date:
05 March 2024
Copyright OIST (Okinawa Institute of Science and Technology Graduate University, 沖縄科学技術大学院大学). Creative Commons Attribution 4.0 International License (CC BY 4.0).
Share on:


