


nnp FY2015 Annual Report 3.1 Figure 1

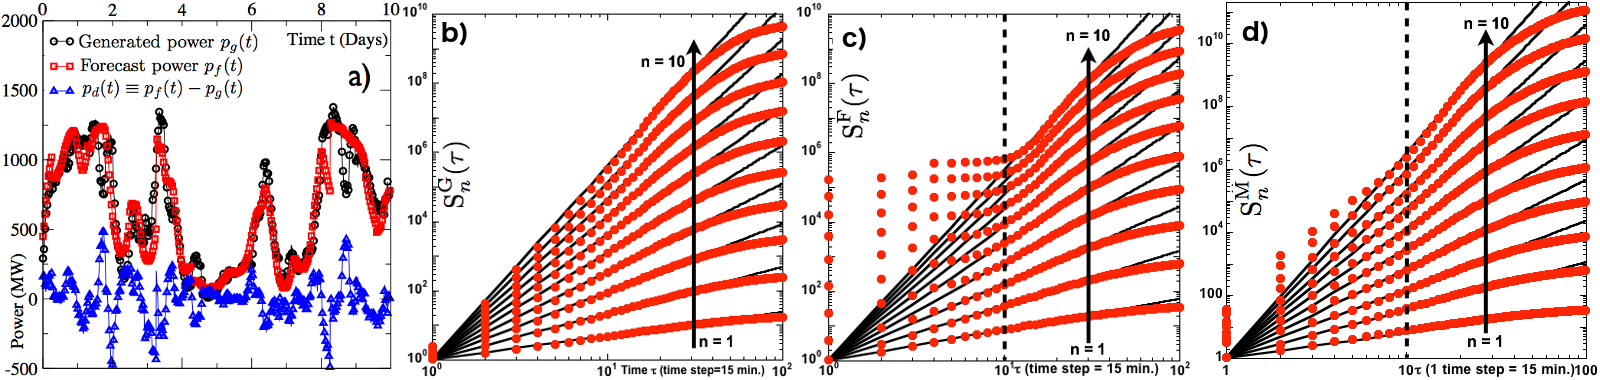
Figure 1: a) A 10 day time record of total wind power generated across Ireland, forecast, and their instantaneous difference. Structure functions quantifying the fluctuations in (b) generated wind power across Ireland, (c) forecast power, and (c) modified forecast with our model.
Date:
05 March 2024
Copyright OIST (Okinawa Institute of Science and Technology Graduate University, 沖縄科学技術大学院大学). Creative Commons Attribution 4.0 International License (CC BY 4.0).
Share on:


