


nnp FY2013 Annual Report 3.1 Figure 2

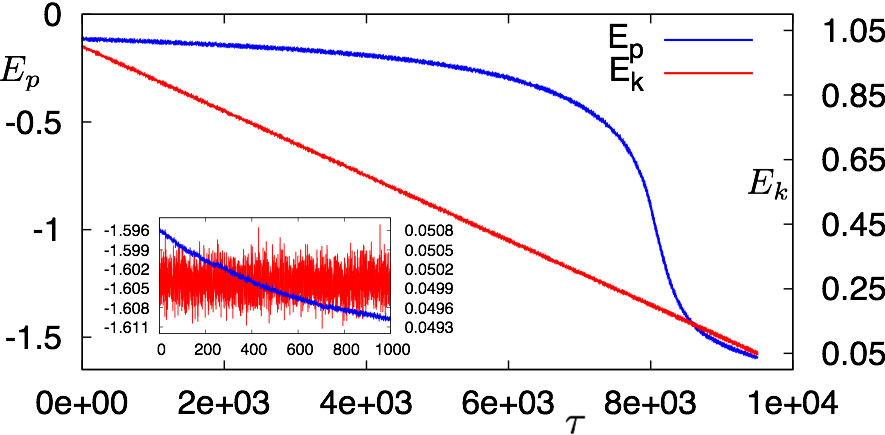
Fig.2 Evolution of potential energy per particle (left Y-axis) and bulk temperature (right Y-axis) have been plotted against simulation time during the slow cooling down of our model system described in the text. During linear ramp-down of bulk temperature, potential energy per particle shows abrupt decay at a temperature which coincides with the liquid-gas critical temperature of bare attraction potential considered.This observation is independent of the repulsion length used in our simulation. After reaching desired temperature T = 0.05 by cooling temperature is held fixed as shown in inset, however, the potential energy continues to decay within the observation time indicating the non-equilibrium state of the system.
Copyright OIST (Okinawa Institute of Science and Technology Graduate University, 沖縄科学技術大学院大学). Creative Commons Attribution 4.0 International License (CC BY 4.0).


