


mgu FY2018 Annual Report fig3

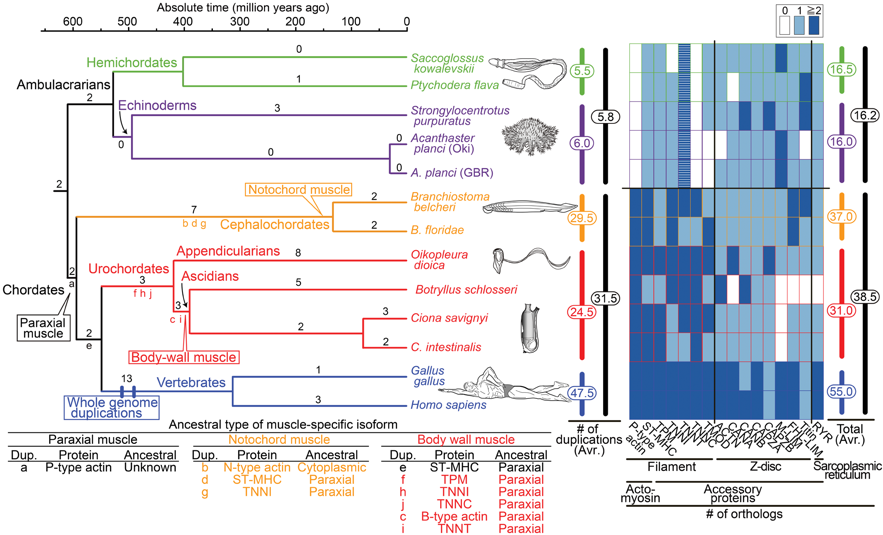
Fig. 3. Time-calibrated deuterostome tree (Holland 1996; Simakov et al. 2015) and evolution of structural (contractile protein) genes of paraxial muscle as a summary of gene tree analyses (supplementary fig. S2A–P, Supplementary Material online)
Numbers at branches are counts of isoform families that experienced gene duplication and numbers at vertical bars (middle) are total counts of gene d uplications in major lineages (supplementary fig. S3, Supplementary Material online). The heat map (right) reflects the estimated number of orthologs (table 1). Striped boxes in ambulacrarian troponin T indicate ambiguity of their functions as in chordate troponin T. The table (below) indicates inferred ancestral types of muscle-specific isoforms.
Copyright OIST (Okinawa Institute of Science and Technology Graduate University, 沖縄科学技術大学院大学). Creative Commons Attribution 4.0 International License (CC BY 4.0).


