


mgu FY2018 Annual Report fig2

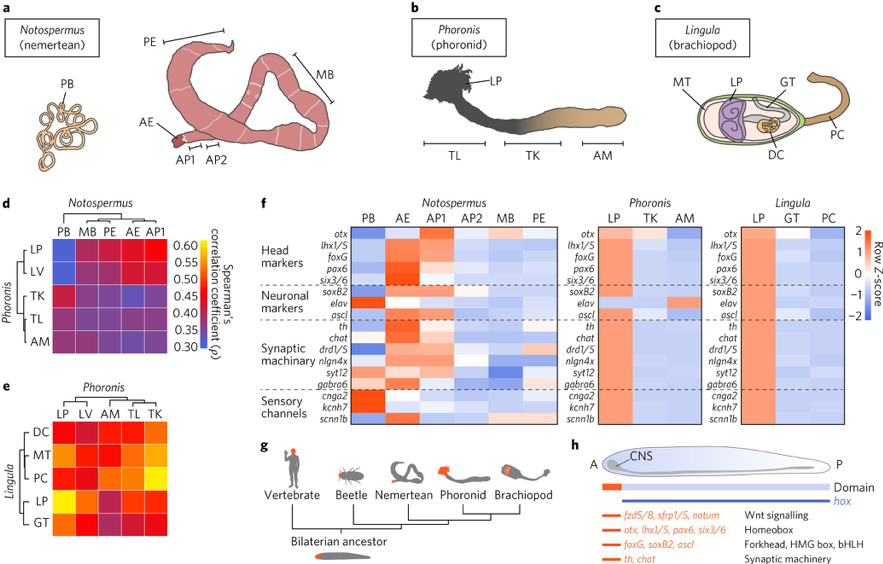
Fig. 2. Comparative transcriptomics reveals molecular similarities between lophophores and bilaterian heads. a–c, Cartoon illustrations of an adult Notospermus (a), Phoronis (b) and Lingula (c; with the dorsal shell removed) with the anterior end facing left. d,e, Analyses of Spearman’s correlation coefficient (ρ) and hierarchical clustering with expression levels of 8,650 orthologous genes from larvae and adult tissues of Notospermus versus Phoronis (d) and Phoronis versus Lingula (e). f, Expression profiles of head patterning-related and neuronal genes in the head of Notospermus and lophophores of Phoronis and Lingula. g,h, Schematic representation of anterior–posterior patterning in bilaterians. g, Simplified phylogeny of bilaterians and regions of anterior positioning heads (highlighted in orange). h, Domain map for conserved signalling components, transcription factors and genes associated with synaptic machinery along the anterior–posterior axis in the last common bilaterian ancestor. A, anterior; AE, anterior end; AM, ampulla; AP1, anterior part 1; AP2, anterior part 2; bHLH, basic helix-loop-helix; CNS, central nervous system; DC, digestive caecum; GT, gut; HMG, high mobility group; LP, lophophore; LV, larva; MB, mid-body; MT, mantle; P, posterior; PB, proboscis; PC, pedicle; PE, posterior end; TK, trunk; TL, trunk with LP.
Copyright OIST (Okinawa Institute of Science and Technology Graduate University, 沖縄科学技術大学院大学). Creative Commons Attribution 4.0 International License (CC BY 4.0).


