


mgu FY2016 Annual Report 3.2 fig3

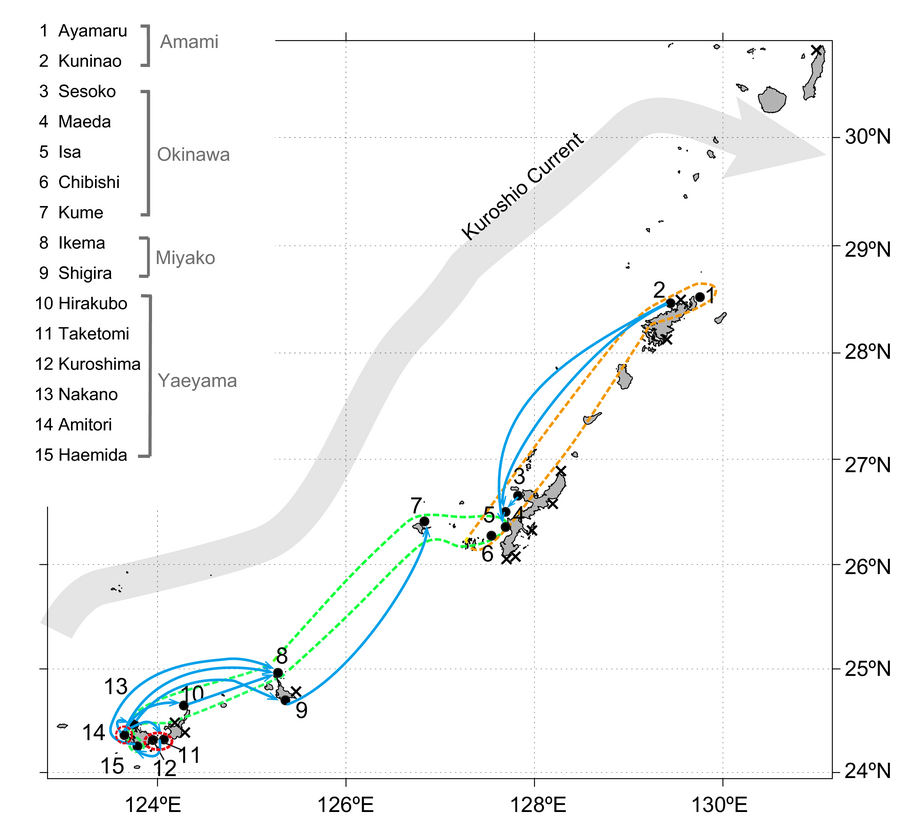
Figure 3: Gene flow in Acropora tenuis in the Nansei Islands does not simply follow the Kuroshio Current. Blue arrows represent directions of gene flow based on Bayesian inference, but are not meant as specific routes. Only asymmetric combinations with greater than 10-M differences in opposing migration rates are shown as arrows. Regions enclosed with dashed boundaries (orange, green, and red) indicate three rough genetic clusters in Figure 4.
Date:
15 March 2024
Copyright OIST (Okinawa Institute of Science and Technology Graduate University, 沖縄科学技術大学院大学). Creative Commons Attribution 4.0 International License (CC BY 4.0).
Share on:


