


mgu FY2015 Annual Report 3.2. fig5

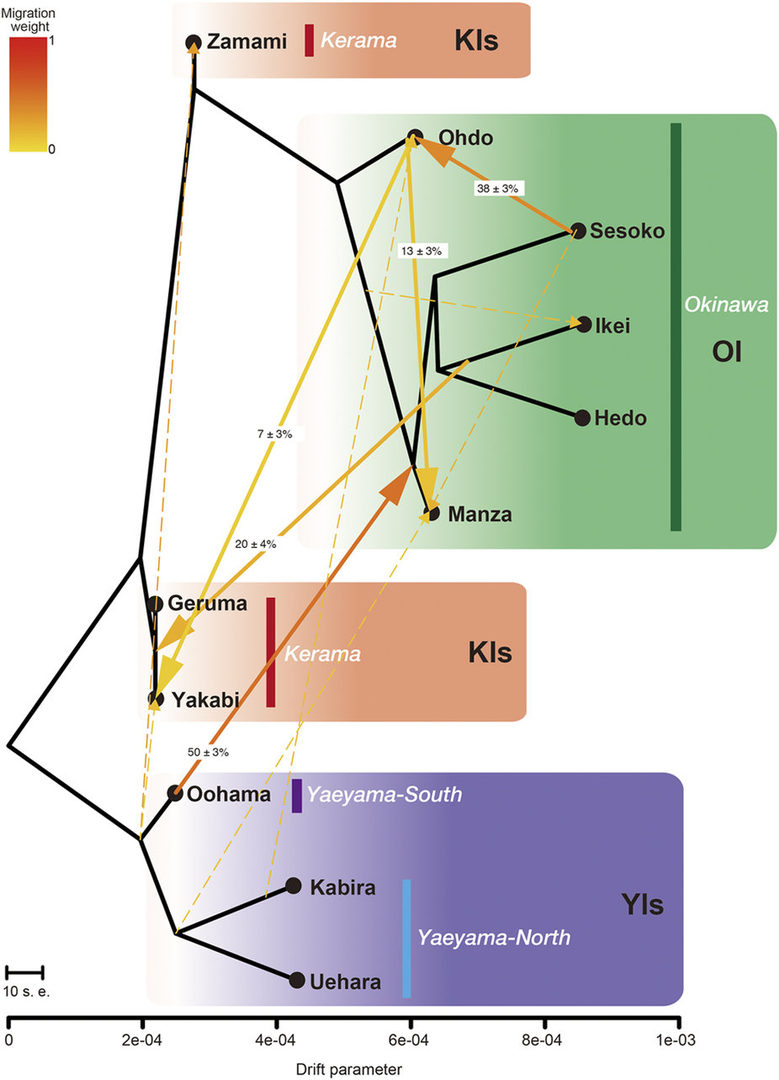
Figure 5. Migration patterns of A. digitifera in the sRA, showing that the YI populations function as source populations for OI, while the KIs constitute a historical sink. Inferred tree of A. digitifera populations in the sRA with thirteen migration events. Migration arrows are colored according to their weight. The migration weight represents the fraction of ancestry derived from the migration edge. Migration edges with p-value estimated by jackknife to be below 0.01 are shown. Migration edges with bootstrap support less than 50% are shown with dotted lines. Horizontal branch lengths are proportional to the amount of genetic drift that has occurred in each branch.
Copyright OIST (Okinawa Institute of Science and Technology Graduate University, 沖縄科学技術大学院大学). Creative Commons Attribution 4.0 International License (CC BY 4.0).


