


mbu FY2016 Annual Report 3.2 Figure 2

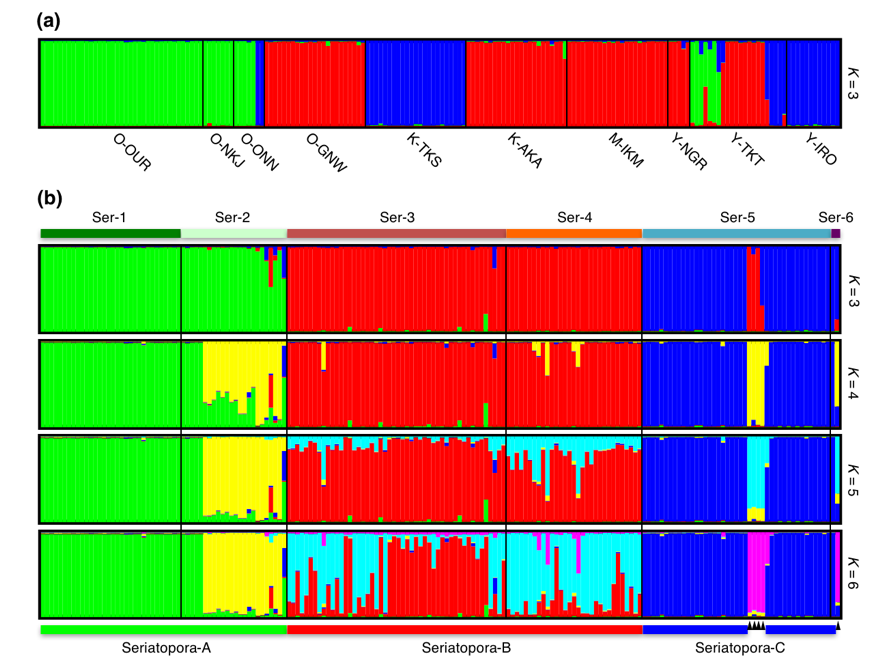
Figure 2: STRUCTURE analysis for 182 microsatellite multilocus genotypes. Analyses for each genetic lineage were conducted with 176 genotypes after removing the duplicate genotypes of clonemates. Probable cluster number, shown as K, for each site (a) was assumed as three (K= 3) based on the method described by Evanno et al. (2005). Probable cluster number Kfor each genetic lineage (b) was assumed as K= 3–6. The arrows show the undefined lineage detected by this analysis
Date:
07 March 2024
Copyright OIST (Okinawa Institute of Science and Technology Graduate University, 沖縄科学技術大学院大学). Creative Commons Attribution 4.0 International License (CC BY 4.0).
Share on:


