


mbu FY2016 Annual Report 3.1 Figure 1

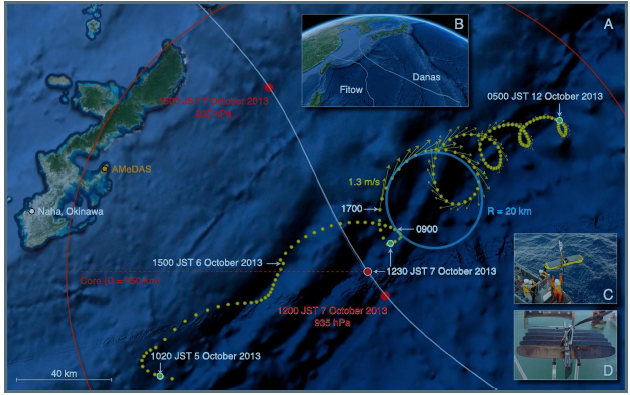
Figure 1. The Wave Glider made a close approach to the center of Typhoon Danas and documented rightward clockwise oscillatory motions afterward. (a) Hourly locations of the glider (yellow dots) and the interpolated trajectory of the typhoon center (white line with red symbols; obtained from the Regional Specialized Meteorological Center, Tokyo) are plotted. The red line indicates the outer boundary of the estimated typhoon core (the area with 10 min sustained winds of 15 m/s or faster) at 1230 JST 7 October 2013 when the glider was closest to the typhoon center. Surface velocities (yellow arrows) are shown after 1700 JST 7 October during the rotations. (b) Tracks of Typhoons Fitow and Danas are shown. (c) The glider was retrieved at 0500 JST 12 October 2013. Thesurface float was intact. (d) The underwater wings had become entangled in the umbilical cable while the Wave Glider was beneath the typhoon center,after which the glider rotated with the current.
Copyright OIST (Okinawa Institute of Science and Technology Graduate University, 沖縄科学技術大学院大学). Creative Commons Attribution 4.0 International License (CC BY 4.0).


