


mbu FY2015 Annual Report 3.1 Figure 2

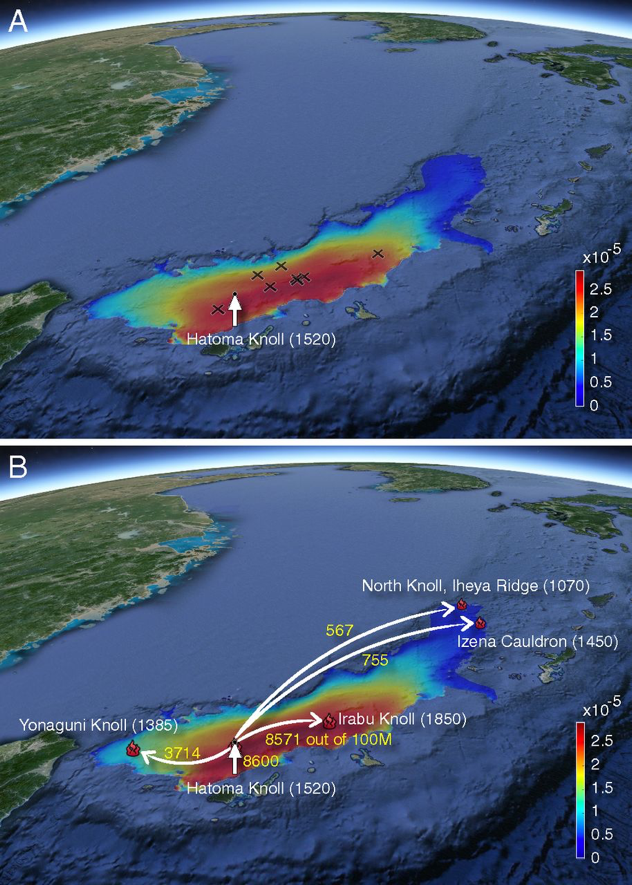
Figure 2: The ocean circulation model effectively quantifies potential larval dispersal from Hatoma Knoll. (A) Distributions of deep-profiling floats (cross markers) from Hatoma Knoll (white arrow) after 90 d of drifting 1,000 m below the sea surface show good agreement with predictions by the ocean circulation model (color contour). Colors indicate probability densities of float displacement per unit area (square kilometers). (B) Transport from Hatoma Knoll to other vent fields at a dispersal depth of 1,000 m (lines and numbers) deduced from the model. Five representative vent fields are shown. Numbers in brackets indicate the depth of each vent field. Drift time was set to the population mean for the mean temperature at a depth of 1,000 m (83 d). Numbers indicate the number of expected connections out of 100 million independent events. The number beside Hatoma Knoll represents likelihood of self-recruitment.
Copyright OIST (Okinawa Institute of Science and Technology Graduate University, 沖縄科学技術大学院大学). Creative Commons Attribution 4.0 International License (CC BY 4.0).


