


mbu FY2015 Annual Report 3.1 Figure 1

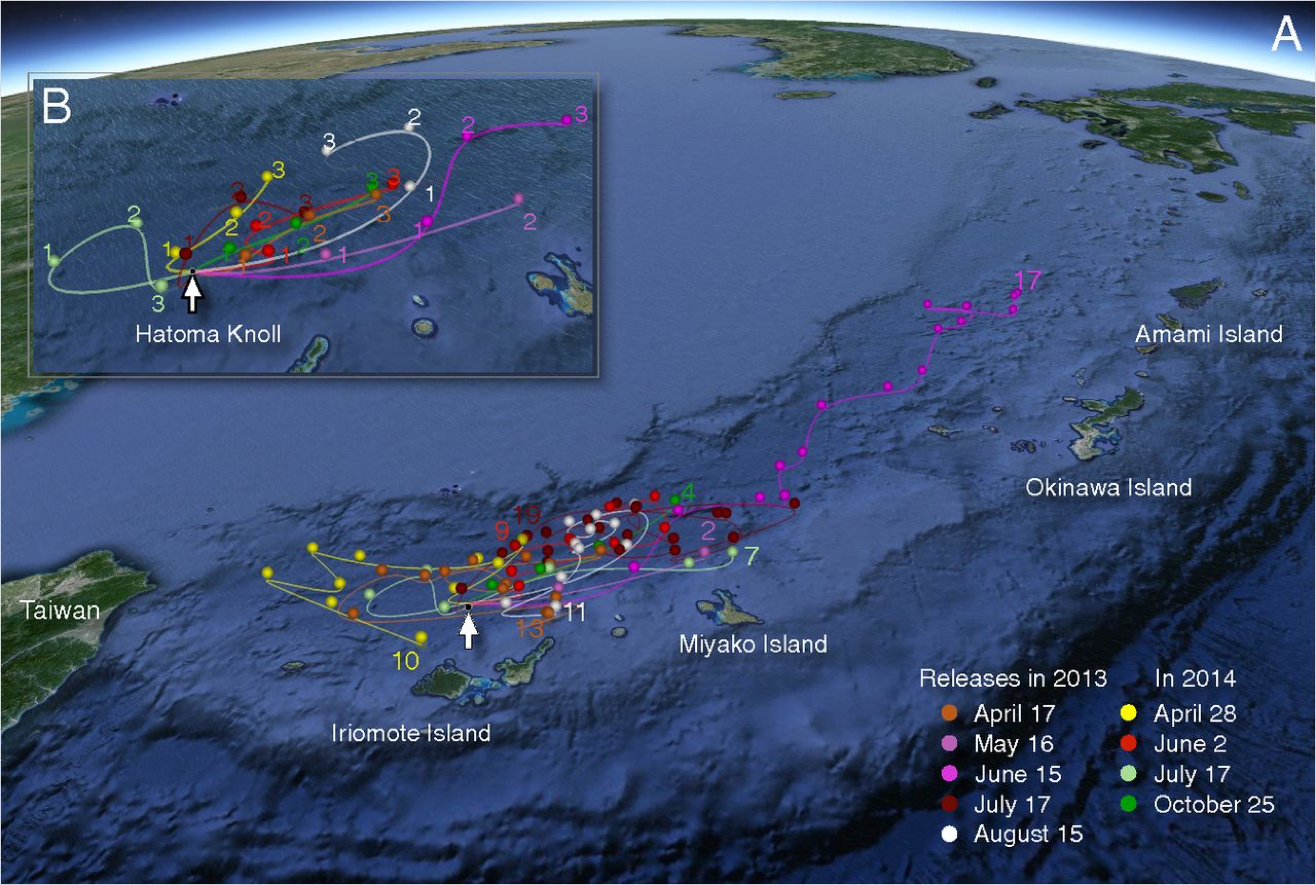
Figure 1: Dispersal processes in the deep sea show complex eddy motions, changing monthly or more often. (A) Trajectories of deep-sea profiling floats released from Hatoma Knoll (indicated with white arrows) in the Okinawa Trough, illustrating dispersal originating at a vent field within a back-arc basin. Floats were deployed semimonthly in 2013 and 2014 on dates indicated at the bottom right corner of the figure. Float tracks until March 2015 are shown here. These passively transported floats maintain their depth 1,000 m below the sea surface and return to the surface every 30 d (circles). Positions of each float at the sea surface are connected with cubic splines. The numbers show the cumulative sum of surfacing events, which indicate approximate drift times in months. (B) Close-up view of the same trajectories for the first three surfacing events.
Copyright OIST (Okinawa Institute of Science and Technology Graduate University, 沖縄科学技術大学院大学). Creative Commons Attribution 4.0 International License (CC BY 4.0).


