


mbnu FY2018 3.5

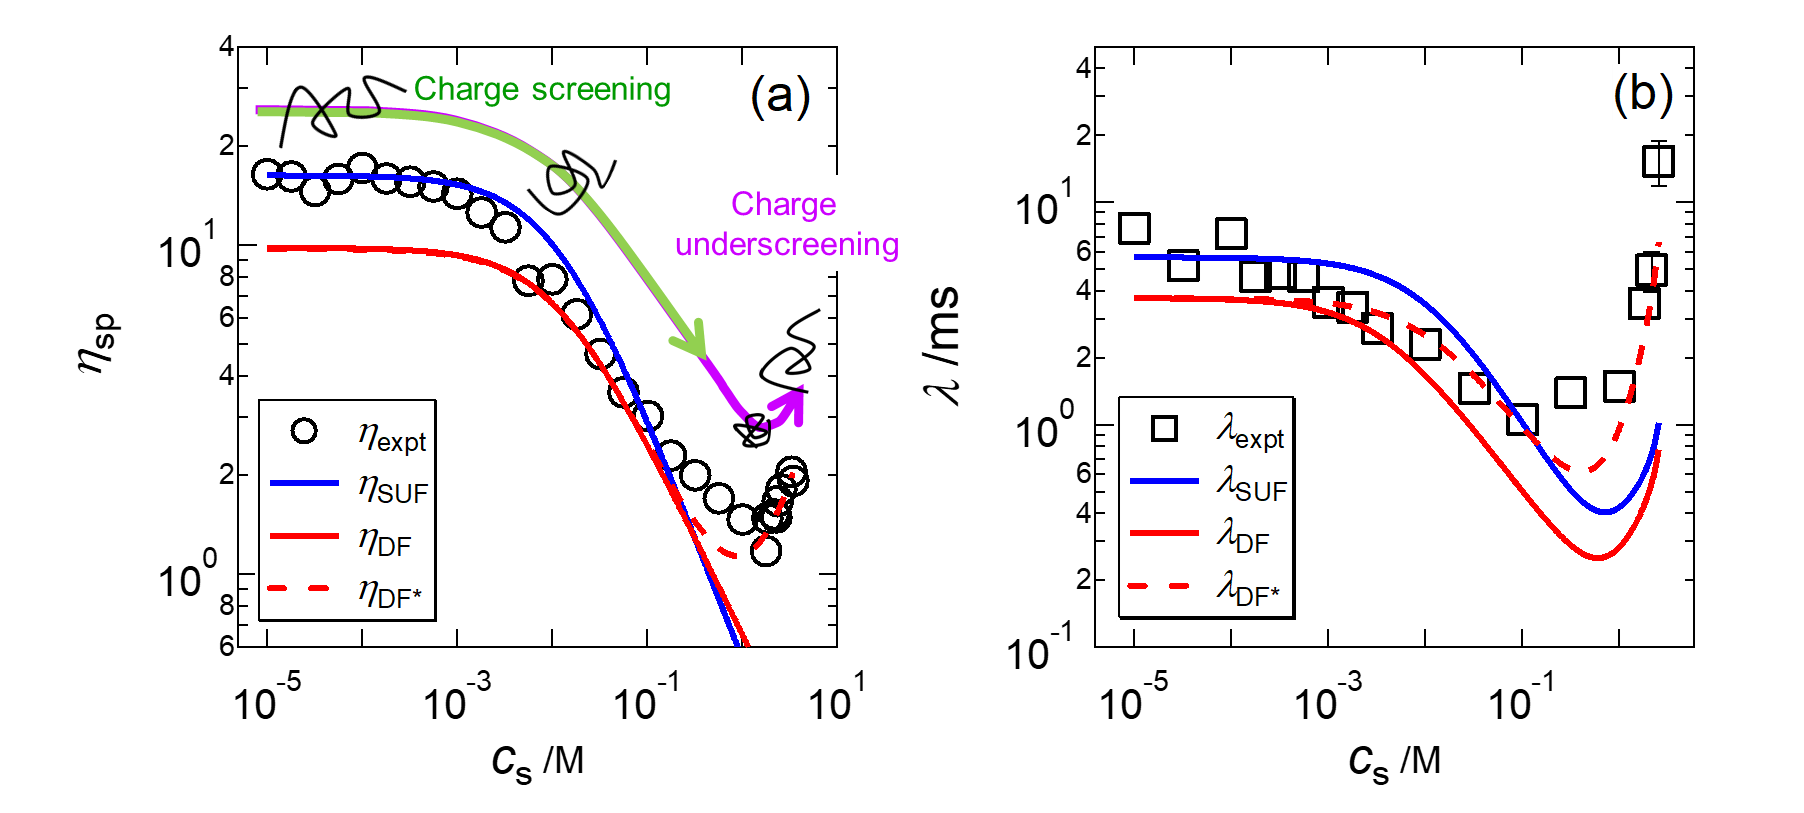
Figure 10. Specific viscosity (circles in a) and longest relaxation time (squares in b) dependence on the ionic liquid concentration. The blue and red solid curves represent the scaling predictions by Dobrynin et al. for polyelectrolyte solutions in the semidilute unentangled and dilute regimes. The red dashed curve represents a modified scaling theory in the dilute regime proposed in our study, accounting for the modified screening length in concentrated salt solutions.
Date:
13 March 2024
Copyright OIST (Okinawa Institute of Science and Technology Graduate University, 沖縄科学技術大学院大学). Creative Commons Attribution 4.0 International License (CC BY 4.0).
Share on:


