


mbnu FY2017 Annual Report 3.1.3 2

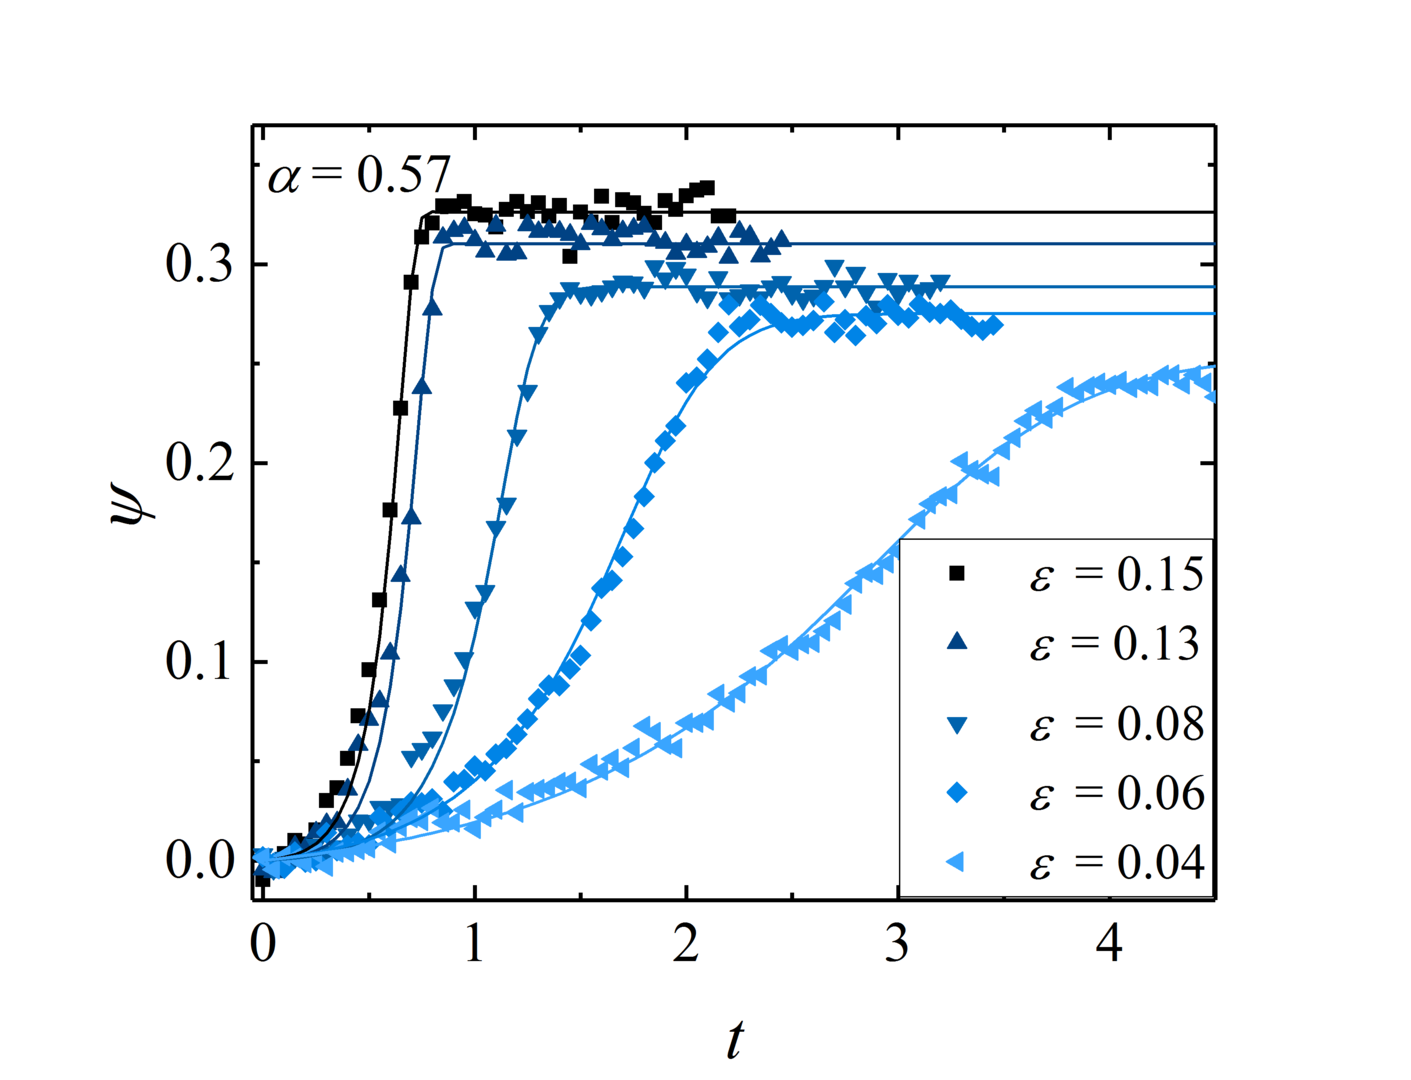
Figure 2: growth of vortex intensity ψ plotted with time, t. The transition slows down as the control parameter ε is decreased to values that are closer to the critical point where ε = 0.
Date:
13 March 2024
Copyright OIST (Okinawa Institute of Science and Technology Graduate University, 沖縄科学技術大学院大学). Creative Commons Attribution 4.0 International License (CC BY 4.0).
Share on:


