


mbnu FY2016 Annual Report 3.2.2

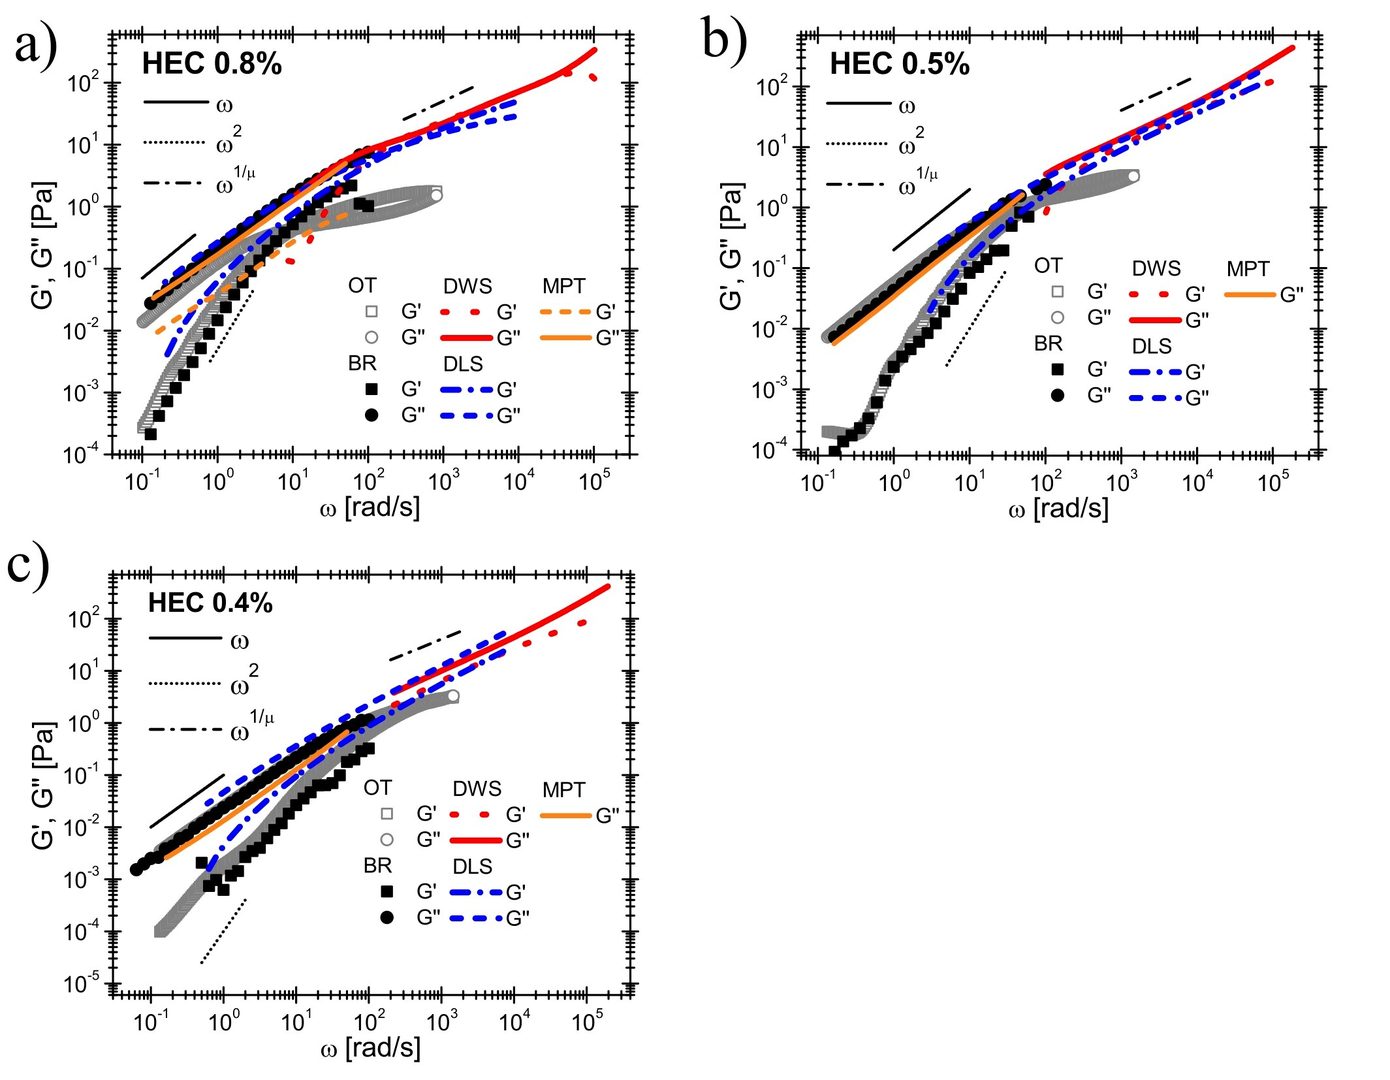
Figure: a) Comparison between the HEC solutions’ linear viscoelastic moduli versus frequency measured with conventional rotational rheometer (BR), with optical tweezers (OT), Diffusive wave spectroscopy (DWS), Dynamic light scattering (DLS) and multiple particle tracking (MPT), for HEC solutions having concentrations of (a) 0.8, (b) 0.5, and (c) 0.4 wt%. The lines are guides for the theoretical predictions. Notice that μ = 1.76 for all the concentrations investigated.
Date:
13 March 2024
Copyright OIST (Okinawa Institute of Science and Technology Graduate University, 沖縄科学技術大学院大学). Creative Commons Attribution 4.0 International License (CC BY 4.0).
Share on:


