


mbnu FY2015 Annual Report 3.1.9

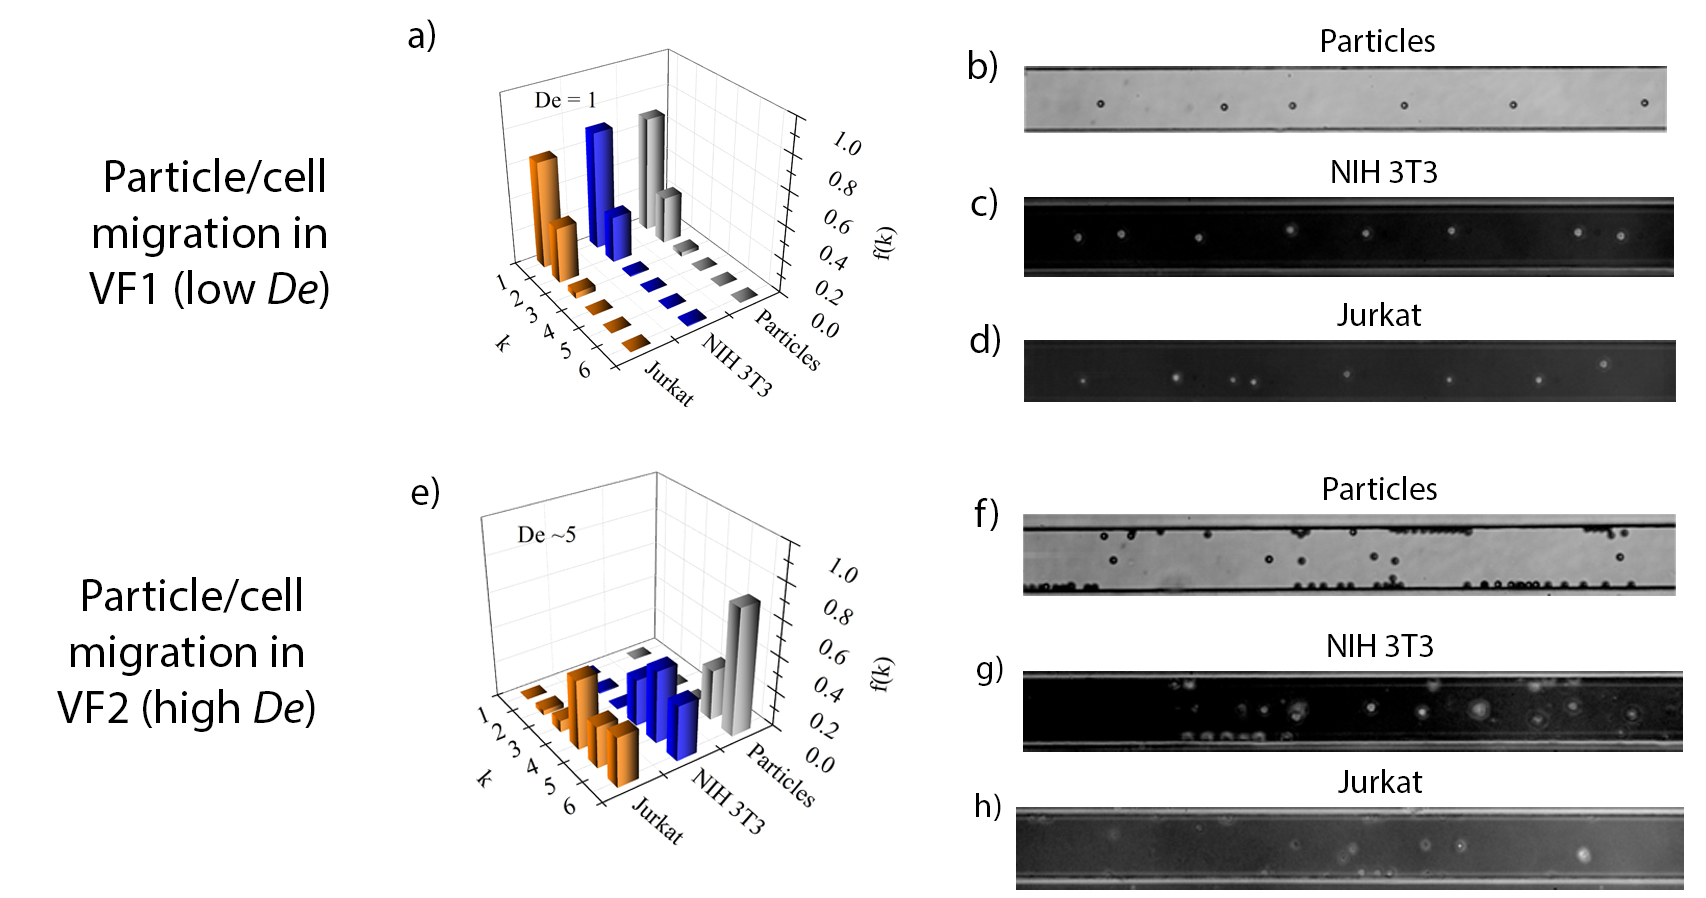
Fig.1: a) Experimental normalized particle distribution f(k), derived from the analysis of the particle velocity [4], for particles and cells in VF1 at De=1. k is the channel band. (b-d) Experimental snapshots at L=5cm from the channel entrance for particles/cells suspended in VF1 at De=1. The analysis of particles/cells velocity indicates that, at De=1, particles and cells migrate to the centerline. e) Experimental normalized particle distribution f(k) as in a), for particles and cells in VF2 at De=5. (f-h) Experimental snapshots as in (b-d) for particles/cells suspended in VF2 at De=5. At De=5, particles and cells migrate towards the walls. Notice that the particles located at the center of the experimental snapshots (f-h) are not in the centerline, because their measured velocities are lower than those predicted around the centerline. Thus, these particles/cells are located mainly on the centerplane in the band k=4-6.
Copyright OIST (Okinawa Institute of Science and Technology Graduate University, 沖縄科学技術大学院大学). Creative Commons Attribution 4.0 International License (CC BY 4.0).


