


mbnu FY2015 Annual Report 3.1.10

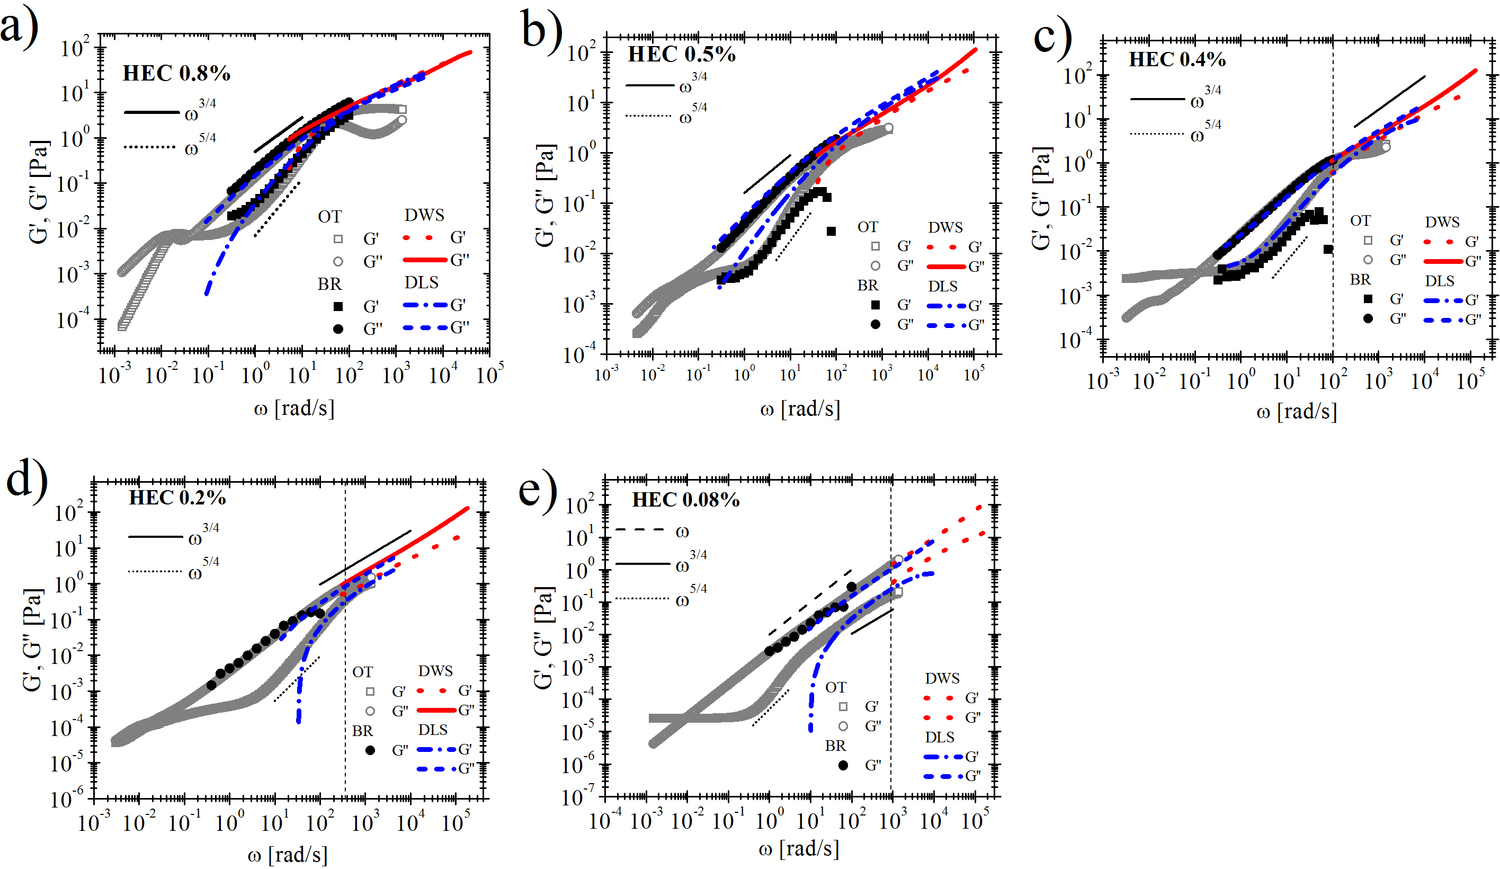
Fig.1: Comparison between the HEC solutions’ linear viscoelastic moduli versus frequency measured with conventional rotational rheometer (filled symbols), with optical tweezers (open symbols), Diffusive wave spectroscopy DWS (red dotted lines), Dinamyc light scattering DLS at 30 degree angle (blue dashed lines) for HEC concentrations: a) 0.8%, b) 0.5%, c) 0.4%, d) 0.2%, e) 0.08%w/w. Notice that the data obtained from both DLS and DWS are vertically shifted of a factor α for all the concentrations.Black solid and dotted lines are the theoretical prediction for rod-like polymers. The black vertical dashed lines in c), d), e) is the inverse of the relaxation time λ measured through the microfluidic technique based on particle migration in square-shaped microchannels.
Copyright OIST (Okinawa Institute of Science and Technology Graduate University, 沖縄科学技術大学院大学). Creative Commons Attribution 4.0 International License (CC BY 4.0).


