


g0 FY2020 Annual Report Figure 1

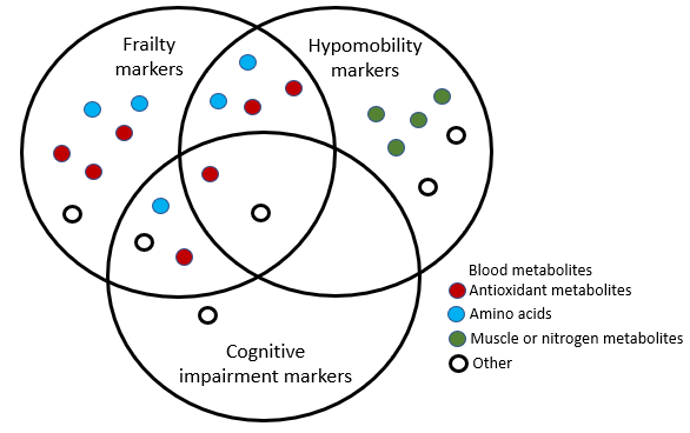
Figure 1. A Venn diagram showing how different metabolites relate to different age-related disorders. 22 different blood metabolites correlating to frailty, cognitive impairment and hypomobility were discovered. Although some of these metabolites were relevant to more than one disorder, frailty was found to have a distinct metabolomic profile.
Date:
28 February 2024
Copyright OIST (Okinawa Institute of Science and Technology Graduate University, 沖縄科学技術大学院大学). Creative Commons Attribution 4.0 International License (CC BY 4.0).
Share on:


