


bcu FY2022 Annual Report 3.1 fig1

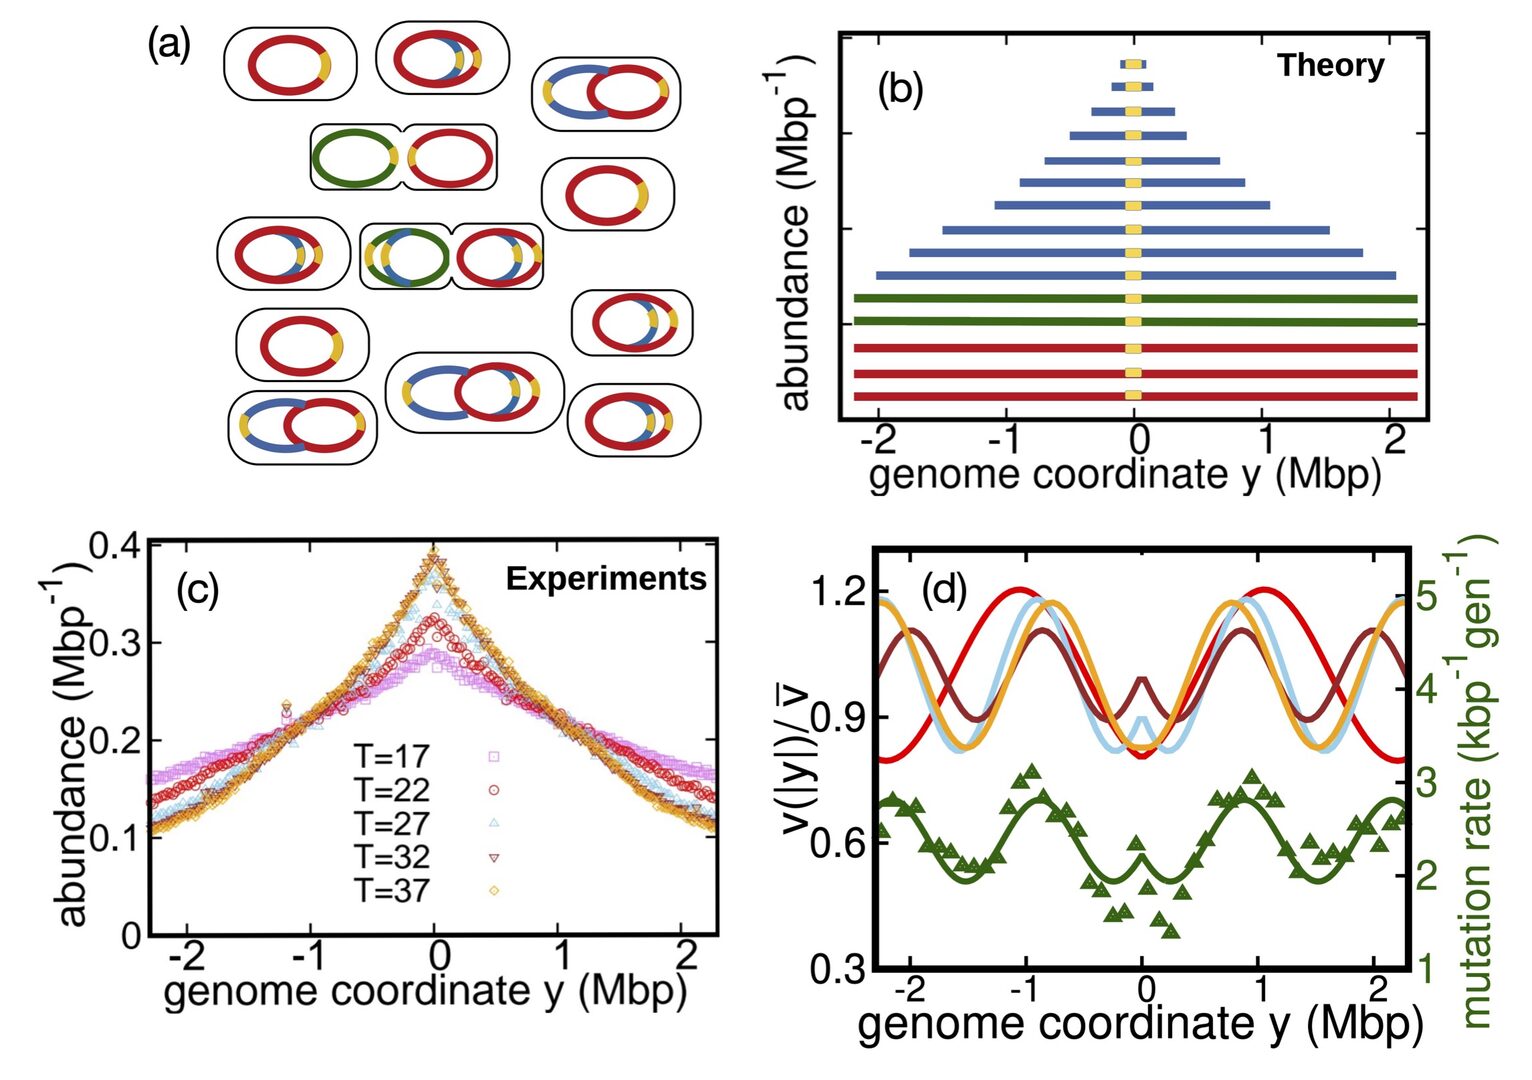
Figure 1: Inferring speed variations of bacterial replisomes. (a) An exponentially growing population of bacteria, with cells at different stages of their cell cycle. (b) DNA abundance distribution predicted by the model. (c) Experimentally measured DNA abundance in E.coli grown at different temperatures. (d) Speed variations inferred by the model, compared with variations of the previously measured local mutation rate (from Niccum et al. 2018).
Date:
13 March 2024
Copyright OIST (Okinawa Institute of Science and Technology Graduate University, 沖縄科学技術大学院大学). Creative Commons Attribution 4.0 International License (CC BY 4.0).
Share on:


