


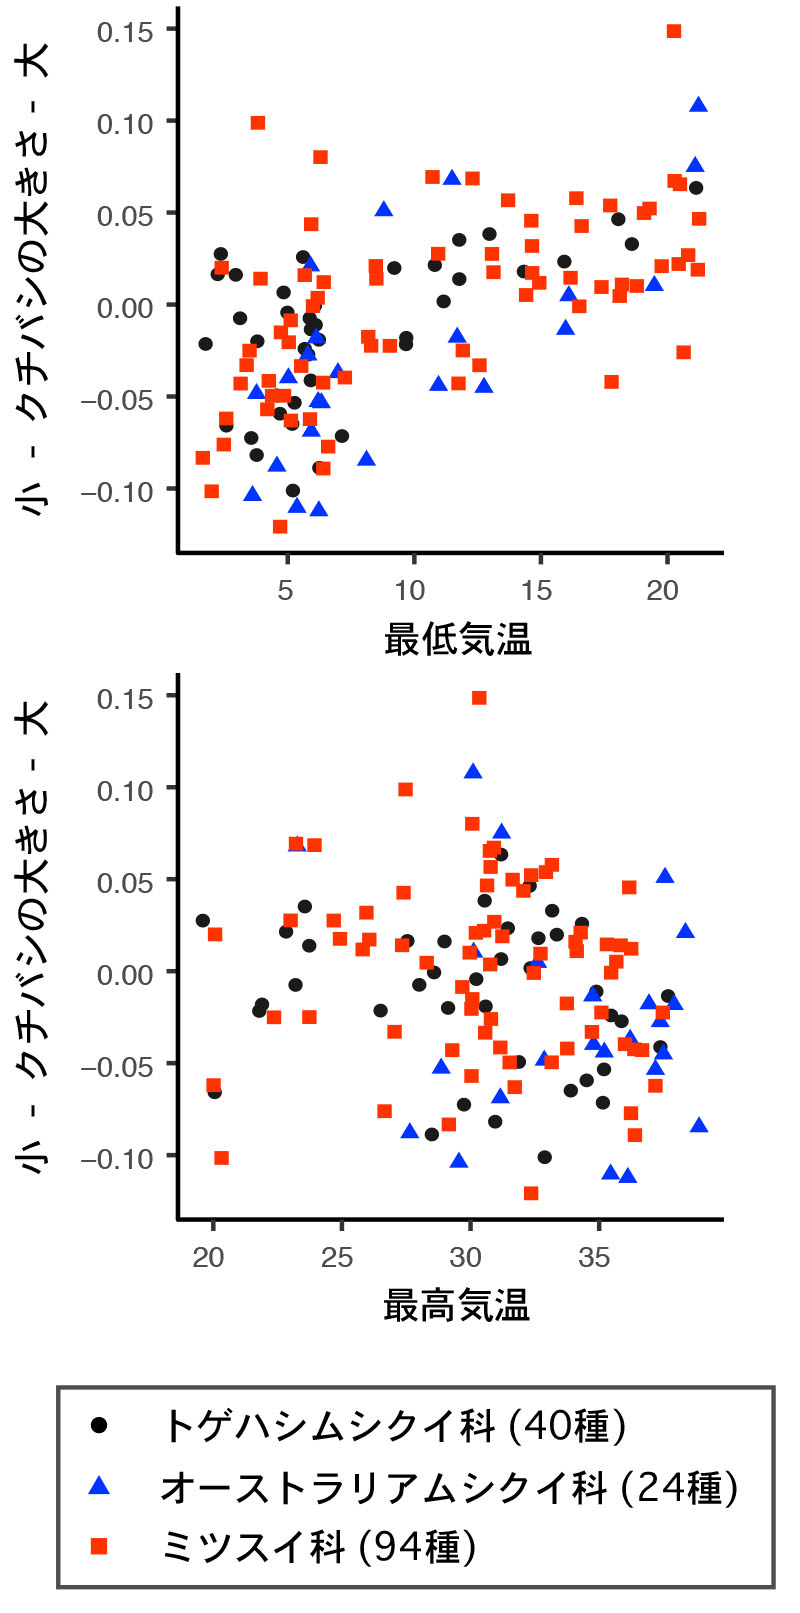
Relationship between winter (top graph) and summer (bottom graph) temperatures vs beak size

The top graph shows a correlation between beak size and winter minimum temperatures, with the smallest beaks relating to the coldest winters. The bottom graph shows no clear correlation for summer maximum temperatures.
The top graph shows a correlation between beak size and winter minimum temperatures, with the smallest beaks relating to the coldest winters. The bottom graph shows no clear correlation for summer maximum temperatures.
Date:
13 July 2017
Copyright OIST (Okinawa Institute of Science and Technology Graduate University, 沖縄科学技術大学院大学). Creative Commons Attribution 4.0 International License (CC BY 4.0).
Tags
Research
Share on:


