


New global map of ant biodiversity reveals areas that may hide undiscovered species

Highlights
- Ants are important for the functioning of ecosystems as they play vital roles from aerating soil and dispersing seeds and nutrients, to scavenging and preying on other species.
- But a global view of their diversity is lacking.
- Now, by combining existing knowledge with machine learning, researchers have developed the first high-resolution map that estimates the global diversity of ants.
- This decade-long project uses data from online repositories, museum collections, and around 10,000 scientific publications and also considers sampling bias.
- The researchers say that it will help add ants, and terrestrial invertebrates in general, to the discussion on biodiversity conservation.
Press release
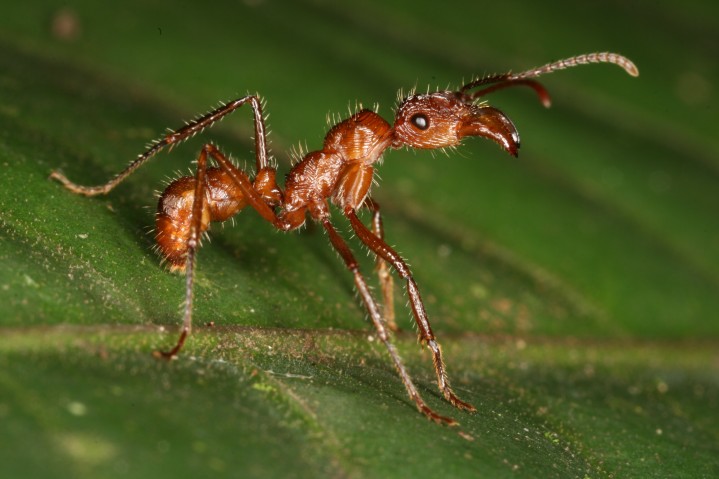
They are hunters, farmers, harvesters, gliders, herders, weavers, and carpenters. They are ants, and they are a big part of our world, comprising over 14,000 species and a large fraction of animal biomass in most terrestrial ecosystems. Like other invertebrates, ants are important for the functioning of ecosystems. They play vital roles from aerating soil and dispersing seeds and nutrients, to scavenging and preying on other species. Yet a global view of their diversity is lacking. Now, researchers from the Biodiversity and Biocomplexity Unit at the Okinawa Institute of Science and Technology (OIST), in collaboration with multiple institutes around the world, have developed a high-resolution map that combines existing knowledge with machine learning to estimate and visualize the global diversity of ants. The maps and dataset were published in an article in Science Advances.
“This study helps to add ants, and terrestrial invertebrates in general, to the discussion on biodiversity conservation,” said Prof. Evan Economo, who leads the Biodiversity and Biocomplexity Unit. “We need to know the locations of high diversity centers of invertebrates so that we know the areas that can be the focus of future research and environmental protection.”
Prof. Economo added that the resource will also serve to answer a number of biological and evolutionary questions, such as how life diversified and how patterns in diversity arose.
This decade-long project began when study co-first author and former OIST postdoc Dr. Benoit Guénard (now at The University of Hong Kong), worked with Prof. Economo to create a database of occurrence records for different ant species from online repositories, museum collections, and around 10,000 scientific publications. Researchers around the world contributed and helped identify errors. More than 14,000 species were considered, which varied dramatically in the amount of data available.
However, the vast majority of these records, while containing a description of the sampled location, did not have the precise coordinates needed for mapping. To address this, coauthor Kenneth Dudley from OIST’s Environmental Informatics Section built a computational workflow to estimate the coordinates from the available data, which also checked all the data for errors.
Then JSPS Postdoctoral Researcher and co-first author Dr. Jamie Kass, with Dudley and research technician Fumika Azuma, made different range estimates for each species of ant depending on how much data was available. For species with less data, they constructed shapes surrounding the data points. For species with more data, the researchers predicted the distribution of each species using statistical models that they tuned for optimal complexity.
The researchers brought these estimates together to form a global map, divided into a grid of 20 km by 20 km squares, that showed an estimate of the number of ant species per square (called the species richness). They also created a map that showed the number of ant species with very small ranges per square (called the species rarity). In general, species with small ranges are particularly vulnerable to environmental changes.
However, there was another problem to overcome—sampling bias. “Some areas of the world that we expected to be centers of diversity were not showing up on our map, but ants in these regions were not well-studied,” explained Dr. Kass. “Other areas were extremely well-sampled, for example parts of the USA and Europe, and this difference in sampling can impact our estimates of global diversity.”
So, the researchers utilized machine learning to predict how their diversity would change if they sampled all areas around the world equally, and in doing so, identified areas where they estimate many unknown, unsampled species exist. Prof. Economo said, “This gives us a kind of ‘treasure map’, which can guide us to where we should explore next and look for new species with restricted ranges."
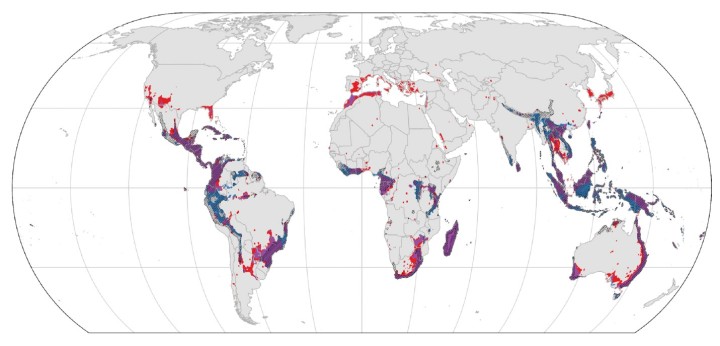
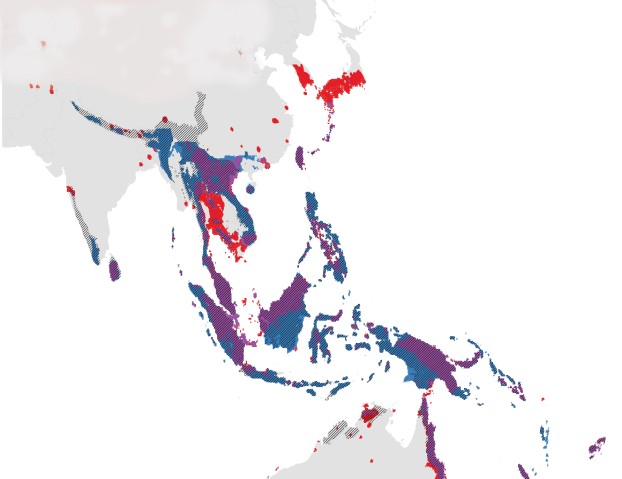
Okinawa, in southern Japan, was identified as a center for rarity, as many species endemic to these islands have very small ranges, around 1000 times smaller than species spread across North America and Europe. Thus, places like Okinawa are critical for environmental protection to conserve biodiversity.
When the researchers compared the rarity and richness of ant distributions to the comparatively well-studied amphibians, birds, mammals, and reptiles, they found that ants were about as different from these vertebrate groups as the vertebrate groups were from each other, which was unexpected given that ants are evolutionarily highly distant from vertebrates. This is important as it suggests that priority areas for vertebrate diversity may also have a high diversity of invertebrate species. But, at the same time, it is necessary to recognize that ant biodiversity patterns do have unique features. For example, the Mediterranean and East Asia show up as diversity centers for ants more than the vertebrates.
Finally, the researchers looked at how well-protected these areas of high ant diversity are. They found that it was a low percentage—only 15% of the top 10% of ant rarity centers had some sort of legal protection, such as a national park or reserve, which is less than existing protection for vertebrates.
“Clearly, we have a lot of work to do to protect these critical areas,” concluded Prof. Economo.
Article Information
Research Unit
For press enquiries, please contact media@oist.jp


